Open Access
Fig. 14.
Download original image
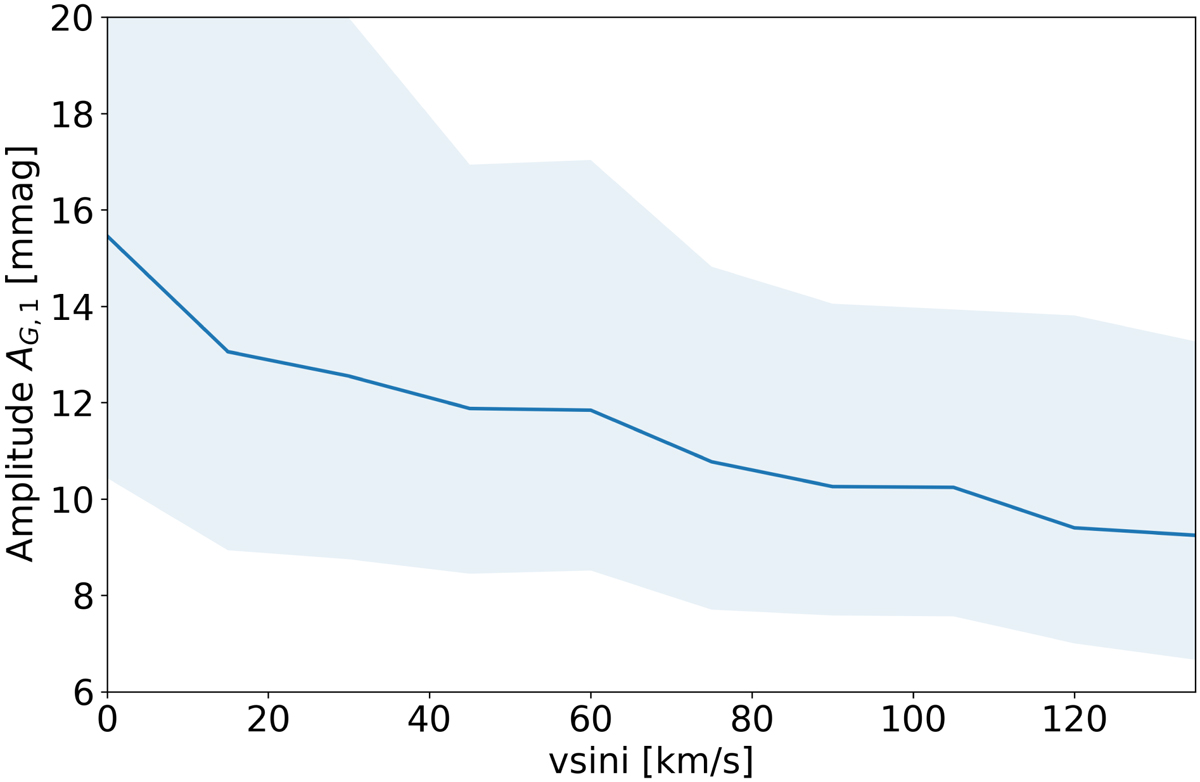
Photometric amplitude A1 in the Gaia G-band as a function of the v sin i derived from spectroscopic Gaia DR3 data for a sample of 3515 δ Sct stars. The dark blue line is the median amplitude for each v sin i bin of 15 km s−1 while the light blue band shows the 25%–75% quantile interval.
Current usage metrics show cumulative count of Article Views (full-text article views including HTML views, PDF and ePub downloads, according to the available data) and Abstracts Views on Vision4Press platform.
Data correspond to usage on the plateform after 2015. The current usage metrics is available 48-96 hours after online publication and is updated daily on week days.
Initial download of the metrics may take a while.