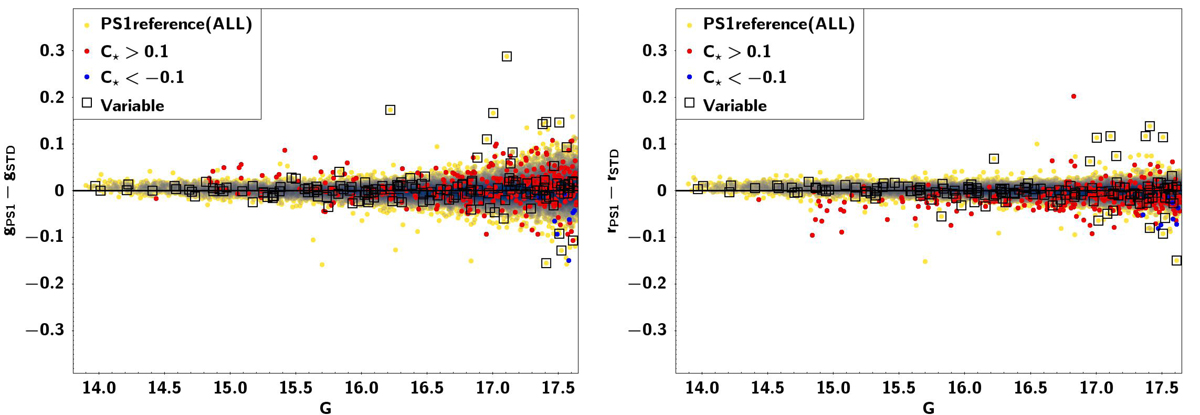
Fig. G.4.
Download original image
Example of the different distribution of C⋆ in Δmag in different passbands using the PS1 reference sample. We note that source with high positive C⋆ tend to have positive residuals in gPS1 and negative residuals in rPS1. Also, most of the outliers in both plots are accounted for by sources with (relatively) large absolute C⋆ values and by sources classified as variable (see also Fig. 8).
Current usage metrics show cumulative count of Article Views (full-text article views including HTML views, PDF and ePub downloads, according to the available data) and Abstracts Views on Vision4Press platform.
Data correspond to usage on the plateform after 2015. The current usage metrics is available 48-96 hours after online publication and is updated daily on week days.
Initial download of the metrics may take a while.