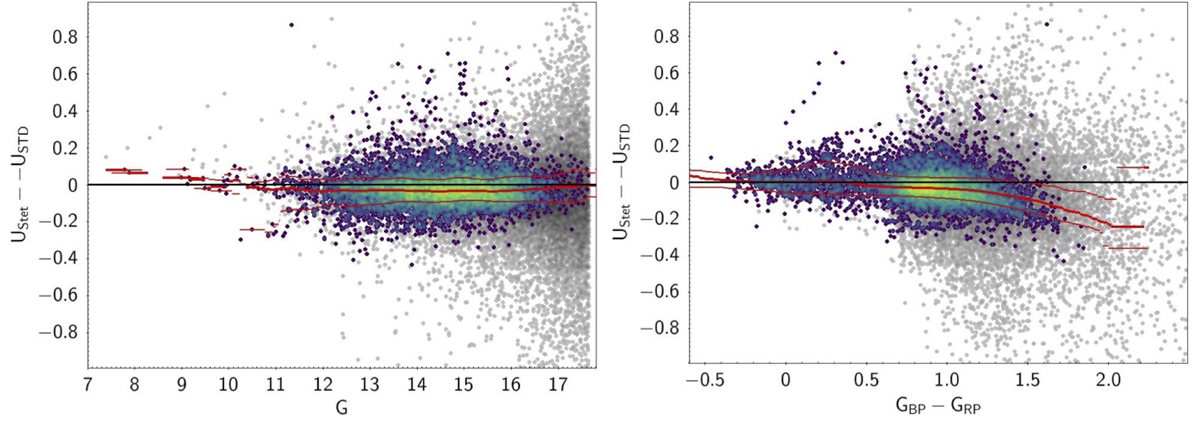
Fig. E.2.
Download original image
Performances of standardised XPSP in the U band of JKC system for the Stetson validating sample. The meaning of the symbols and the arrangement of the plot are the same as in Fig. E.1, except for the y-axes scale, which is much more expanded here. The 29176 stars in the Stetson validating sample having their XP spectra released in Gaia DR3, G < 17.65, and valid UStet and USTD magnitudes are represented as grey dots, while those shown as a viridis density maps are the 9157 that also have flux_U/flux_error_U> 30. P50, P16, and P84 lines refer to the latter subsample.
Current usage metrics show cumulative count of Article Views (full-text article views including HTML views, PDF and ePub downloads, according to the available data) and Abstracts Views on Vision4Press platform.
Data correspond to usage on the plateform after 2015. The current usage metrics is available 48-96 hours after online publication and is updated daily on week days.
Initial download of the metrics may take a while.