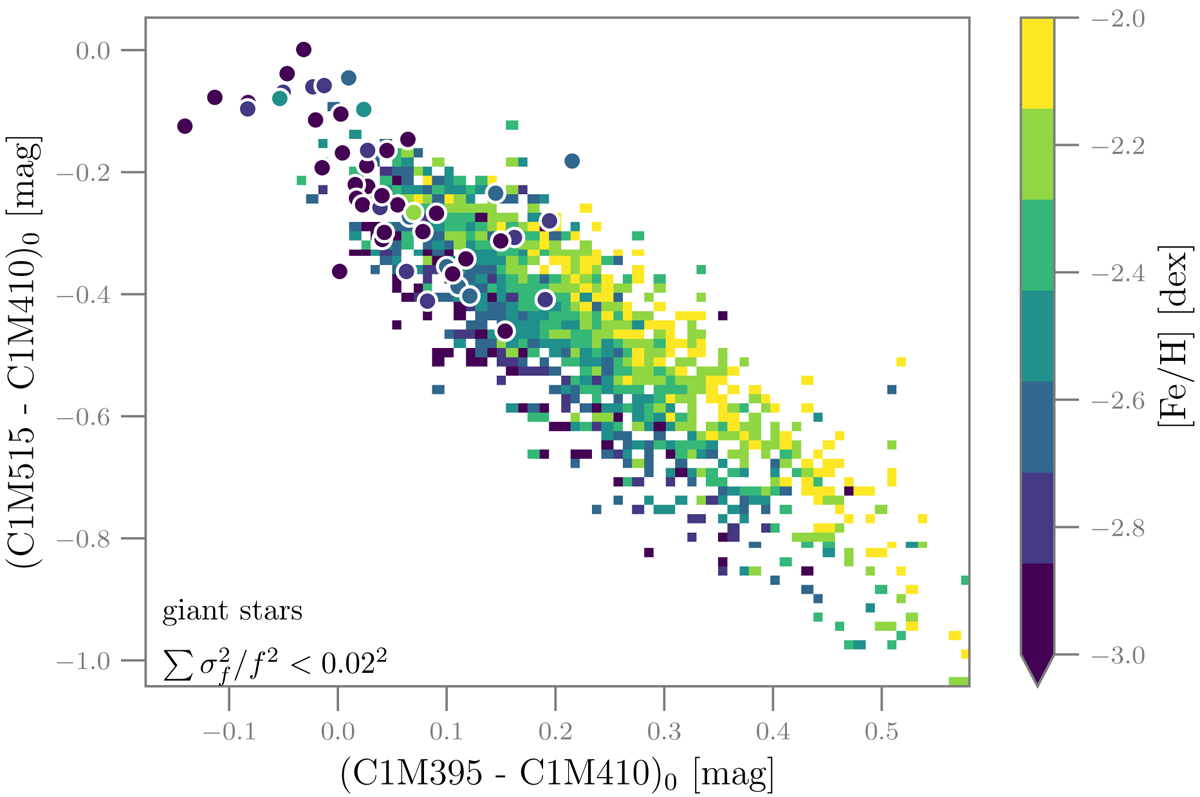
Fig. 33.
Download original image
C1 colour-colour diagram sensitive to metallicity and corrected for extinction. The histogram shows the distribution of a random subset of 5112 giant stars with [Fe/H] < −2 dex from Huang et al. (2022) with a total fractional flux uncertainty in the C1 bands of below 0.02. The colours refer to their photometric iron abundance estimates with the scale on the right-hand size. The round symbols indicate the 48 stars (not only giants) from Pristine discussed in Sect. 5.4 on the same scale using their spectroscopic estimates. The x and y axes are equivalent to CaII and MgH indices, respectively.
Current usage metrics show cumulative count of Article Views (full-text article views including HTML views, PDF and ePub downloads, according to the available data) and Abstracts Views on Vision4Press platform.
Data correspond to usage on the plateform after 2015. The current usage metrics is available 48-96 hours after online publication and is updated daily on week days.
Initial download of the metrics may take a while.