Fig. 29.
Download original image
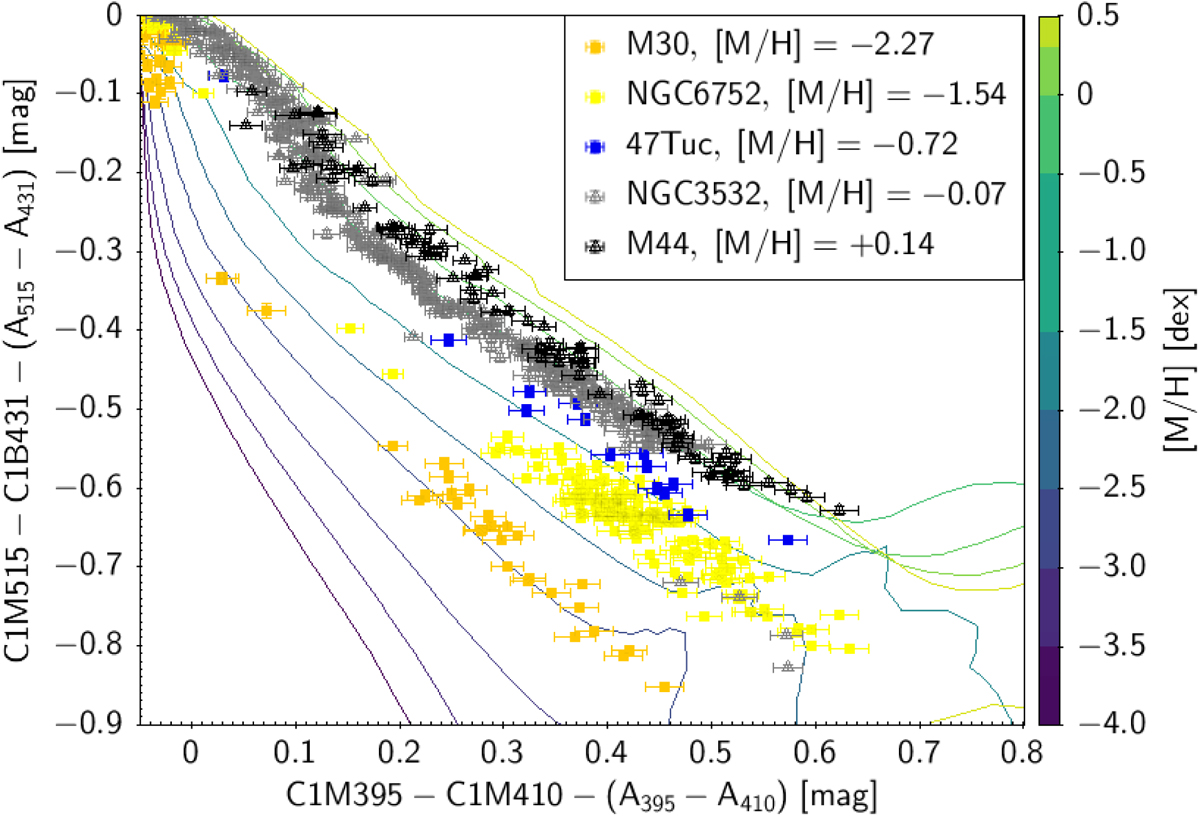
C1 colour–colour diagram sensitive to global metallicity for a set of clusters corrected for reddening using AX absorption values in that passband derived as indicated in Appendix H. Lines represent the simulations performed using the BTSettl library (Allard et al. 2013; with a line colour depending on the global metallicity, [M/H]). Solid squares represent the stars in GCs and empty triangles the stars in OCs, all of them with their error bars. BTSettl models with log g = 2.0 are plotted for GCs, and log g = 3.0 for OCs.
Current usage metrics show cumulative count of Article Views (full-text article views including HTML views, PDF and ePub downloads, according to the available data) and Abstracts Views on Vision4Press platform.
Data correspond to usage on the plateform after 2015. The current usage metrics is available 48-96 hours after online publication and is updated daily on week days.
Initial download of the metrics may take a while.