Fig. 17.
Download original image
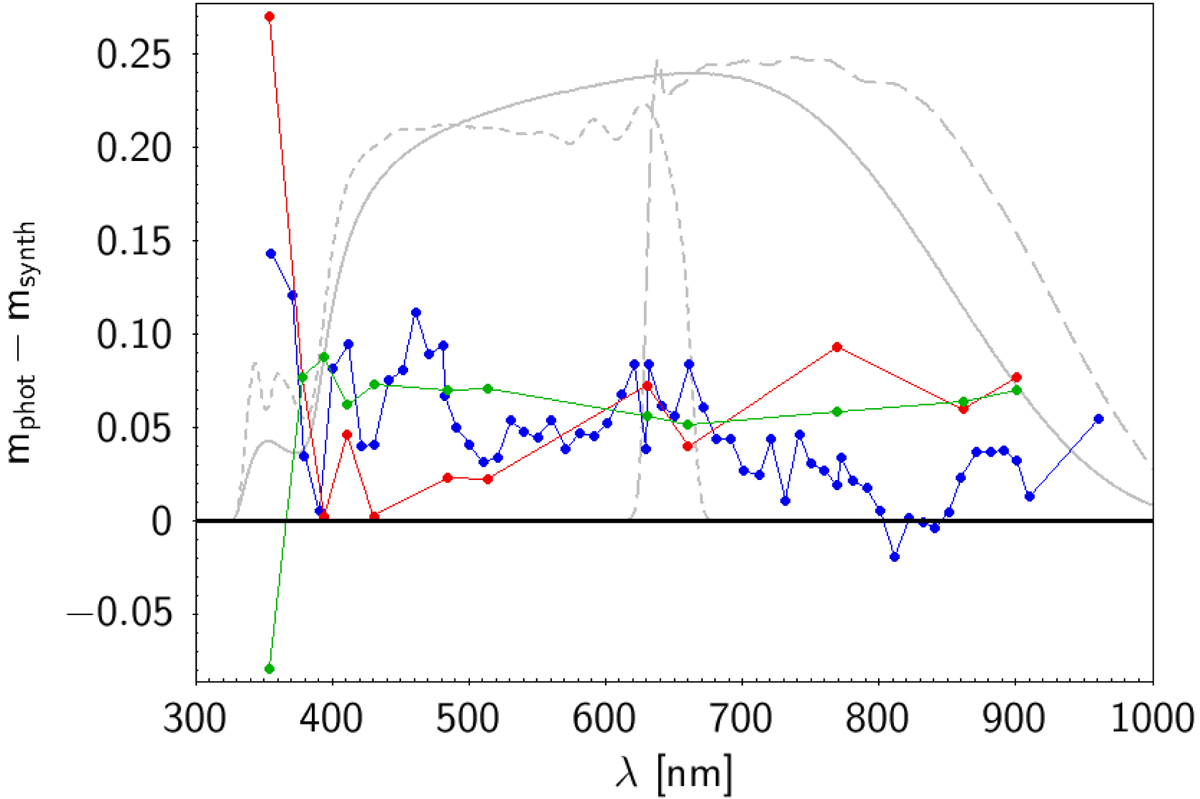
Median residuals between the observed and synthetic magnitudes as a function of the mean wavelengths of the passbands for mini-JPAS (blue), J-PLUS in APOGEE DR16 (red), and J-PLUS WDs (green). In grey lines, we plot the Gaia passband transmissivity as in Gaia EDR3 (Riello et al. 2021) divided by a factor three to fit in the same scale of the residuals. The solid grey line represents G band, the short dashed line BP band (at shorter wavelengths), and the long dashed line RP band (at longer wavelengths).
Current usage metrics show cumulative count of Article Views (full-text article views including HTML views, PDF and ePub downloads, according to the available data) and Abstracts Views on Vision4Press platform.
Data correspond to usage on the plateform after 2015. The current usage metrics is available 48-96 hours after online publication and is updated daily on week days.
Initial download of the metrics may take a while.