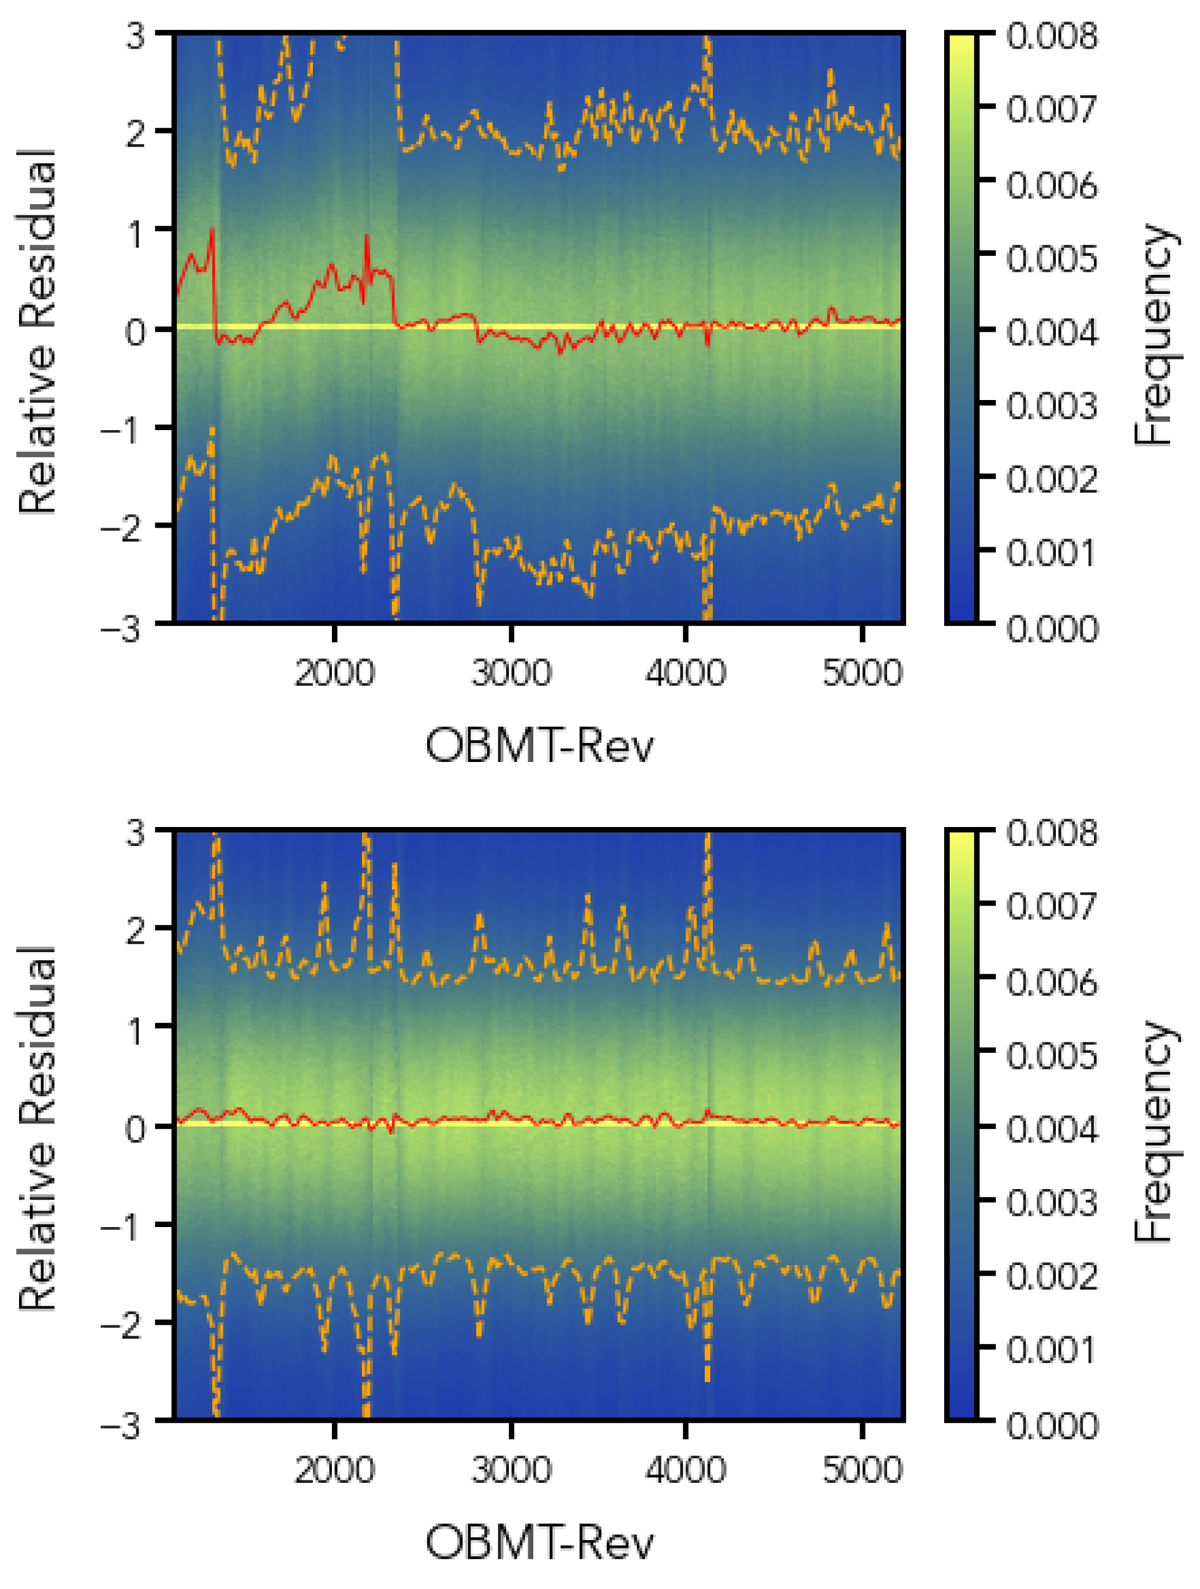
Fig. 9.
Download original image
Relative residual distribution for a subset of the calibrators covering the magnitude range [5, 18]. The top panel shows the BP residuals, while the bottom one shows the RP residuals. Only samples with AL coordinate in the range [10, 50] are included in this plot. The 2D histogram is normalised to the number of measurements in each column.
Current usage metrics show cumulative count of Article Views (full-text article views including HTML views, PDF and ePub downloads, according to the available data) and Abstracts Views on Vision4Press platform.
Data correspond to usage on the plateform after 2015. The current usage metrics is available 48-96 hours after online publication and is updated daily on week days.
Initial download of the metrics may take a while.