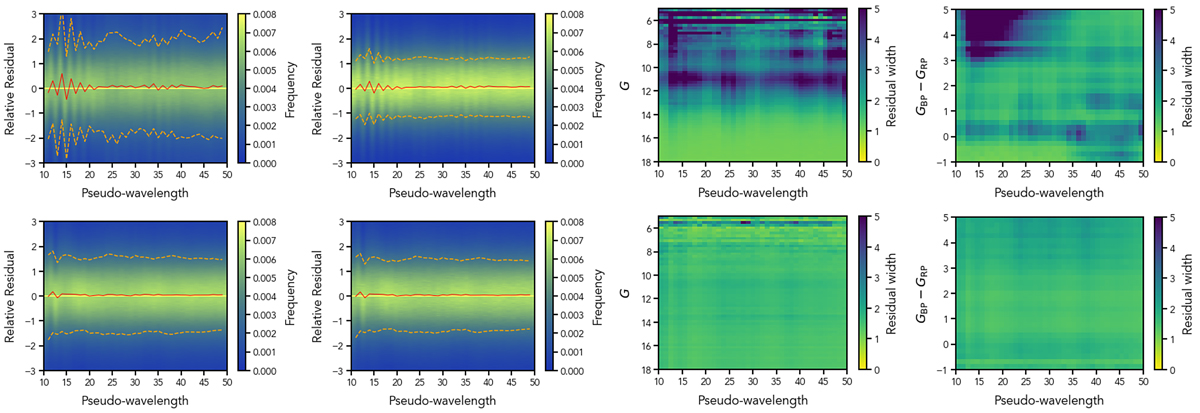
Fig. 8.
Download original image
Relative residual distribution for a subset of the calibrators covering the G-band magnitude range [5, 18]. The first row of plots shows the BP results, while the bottom row shows RP. In each row, the first plot shows the distribution of relative residuals vs. AL coordinate in the range [10, 50] where most of the flux is observed. In the second plot, the same distribution is shown including only data from sources in the magnitude range [13, 17]. In these first two plots, the 2D histogram is normalised to the number of measurements in each column and the relative number of sources is shown by the colour bar. The red line shows the median value, while the orange dashed lines show the 15.865 and 84.134 percentiles. The following two plots show the robust width of the distribution of relative residuals defined as the difference between the 84.134 and 15.865 percentiles divided by two vs. G-band magnitude and GBP − GRP colour and AL coordinate for the entire magnitude range covered by this subset.
Current usage metrics show cumulative count of Article Views (full-text article views including HTML views, PDF and ePub downloads, according to the available data) and Abstracts Views on Vision4Press platform.
Data correspond to usage on the plateform after 2015. The current usage metrics is available 48-96 hours after online publication and is updated daily on week days.
Initial download of the metrics may take a while.