Fig. 7.
Download original image
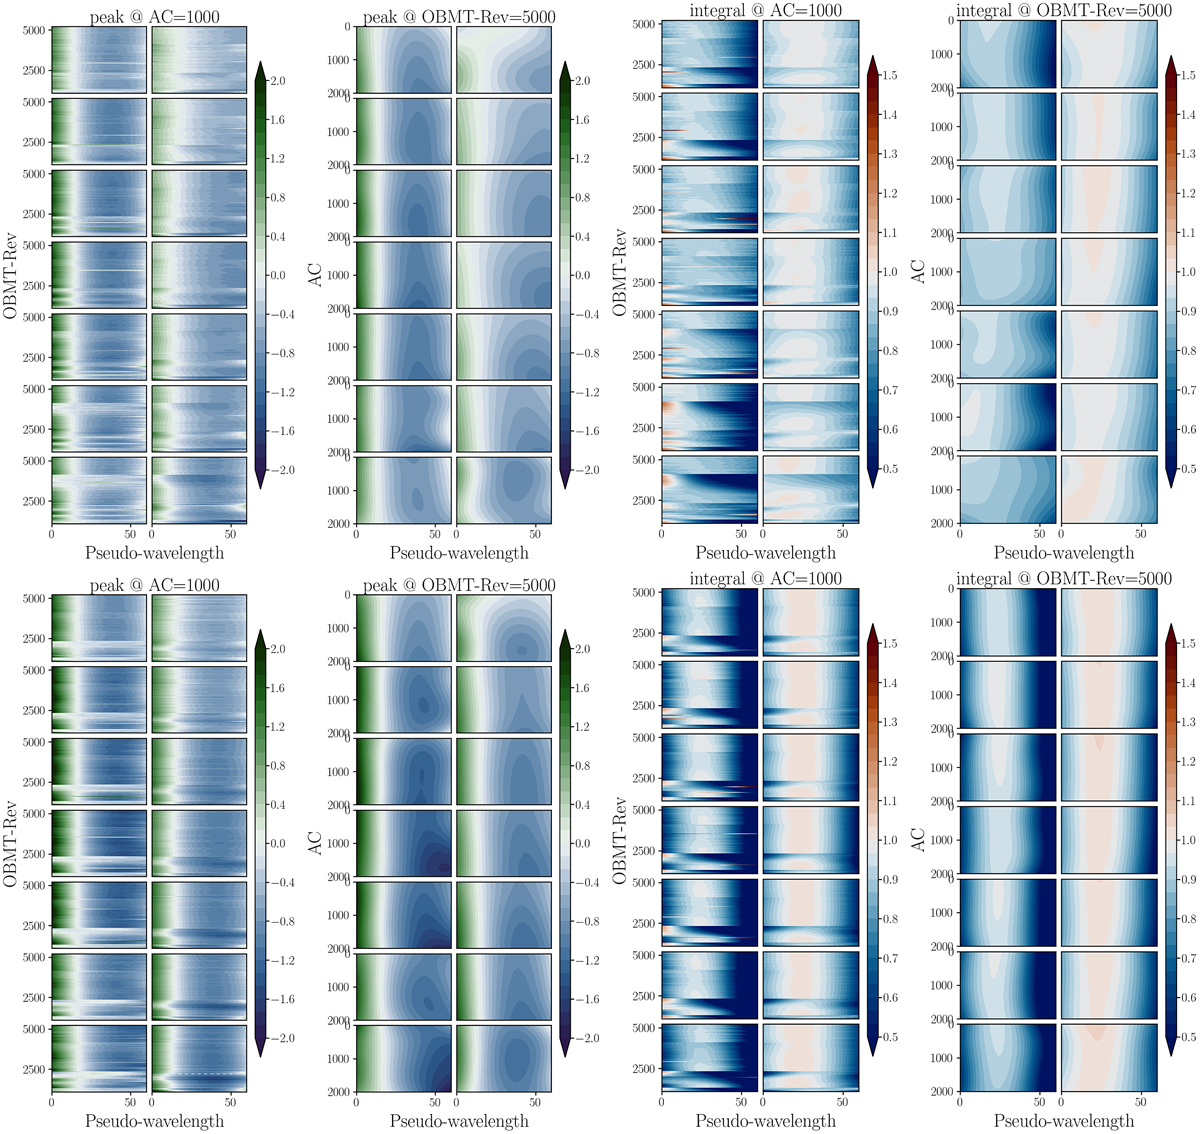
Overview of the BP and RP calibrations for the preceding (first row of plots) and following (second row) FoVs, ungated 1D configuration: peak and integral parameter variations vs. wavelength, time, and AC coordinate are shown for each CCD. Each set of 14 panels show the peak (first two sets) and integral (second two sets) variations (see the top title label and colour bar next to each set) as a function of different parameters: the first set shows the variation of the peak parameter in time (expressed in OBMT-Rev) and pseudo-wavelength, while the second set shows the variation of the same parameter in AC coordinate and pseudo-wavelength, the third and fourth sets show the same dependencies for the integral parameter. When showing the dependency in time and pseudo-wavelength, the parameters have been evaluated at the centre of each CCD in the AC direction (i.e. AC = 1000), while when showing variations with AC coordinate and pseudo-wavelength the reference time OBMT-Rev = 5000 was used. Within each set, the 14 panels show the BP case in the left column of 7 panels (one per CCD) and the RP case in the right column of 7 panels.
Current usage metrics show cumulative count of Article Views (full-text article views including HTML views, PDF and ePub downloads, according to the available data) and Abstracts Views on Vision4Press platform.
Data correspond to usage on the plateform after 2015. The current usage metrics is available 48-96 hours after online publication and is updated daily on week days.
Initial download of the metrics may take a while.