Fig. 28.
Download original image
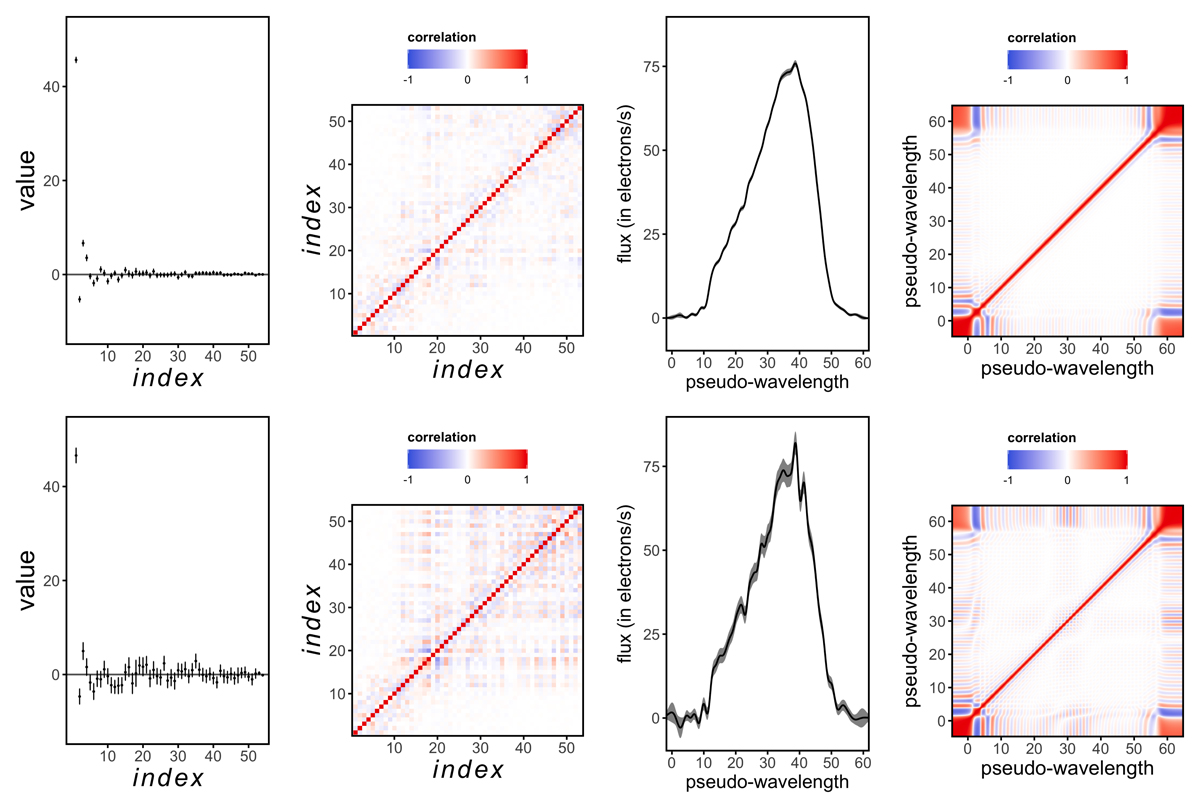
Example of the effect of noise for an RP spectrum. First column: RP coefficients with errors. Second column: correlation matrices for the coefficients. Third column: sampled RP spectrum (black line) with 1-sigma uncertainty interval (grey shaded region). Fourth column: correlation matrix for the sampled RP spectrum. The top row is for 18 transits, and the bottom row for 3 transits, for the same source.
Current usage metrics show cumulative count of Article Views (full-text article views including HTML views, PDF and ePub downloads, according to the available data) and Abstracts Views on Vision4Press platform.
Data correspond to usage on the plateform after 2015. The current usage metrics is available 48-96 hours after online publication and is updated daily on week days.
Initial download of the metrics may take a while.