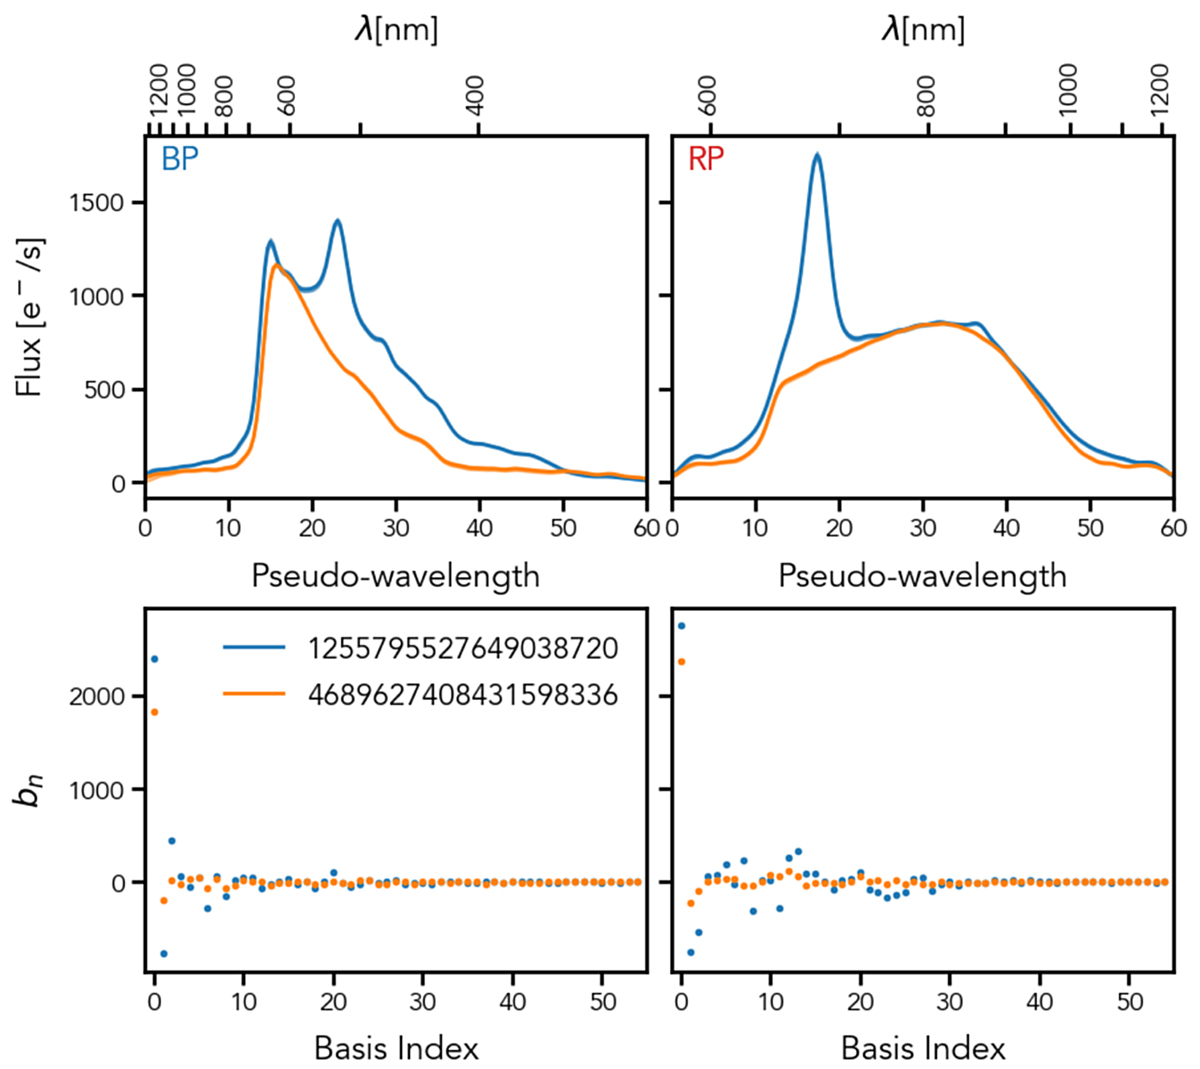
Fig. 27.
Download original image
Comparison of the mean spectra obtained for a QSO with a strong emission line (Gaia DR3 1255795527649038720 in blue), and another source with similar shape and flux level but without strong features (Gaia DR3 4689627408431598336 in orange). BP and RP are shown in the left and right panels, respectively. Sampled spectra are shown in the top panels, while the bottom panels show the corresponding coefficients.
Current usage metrics show cumulative count of Article Views (full-text article views including HTML views, PDF and ePub downloads, according to the available data) and Abstracts Views on Vision4Press platform.
Data correspond to usage on the plateform after 2015. The current usage metrics is available 48-96 hours after online publication and is updated daily on week days.
Initial download of the metrics may take a while.