Fig. 18.
Download original image
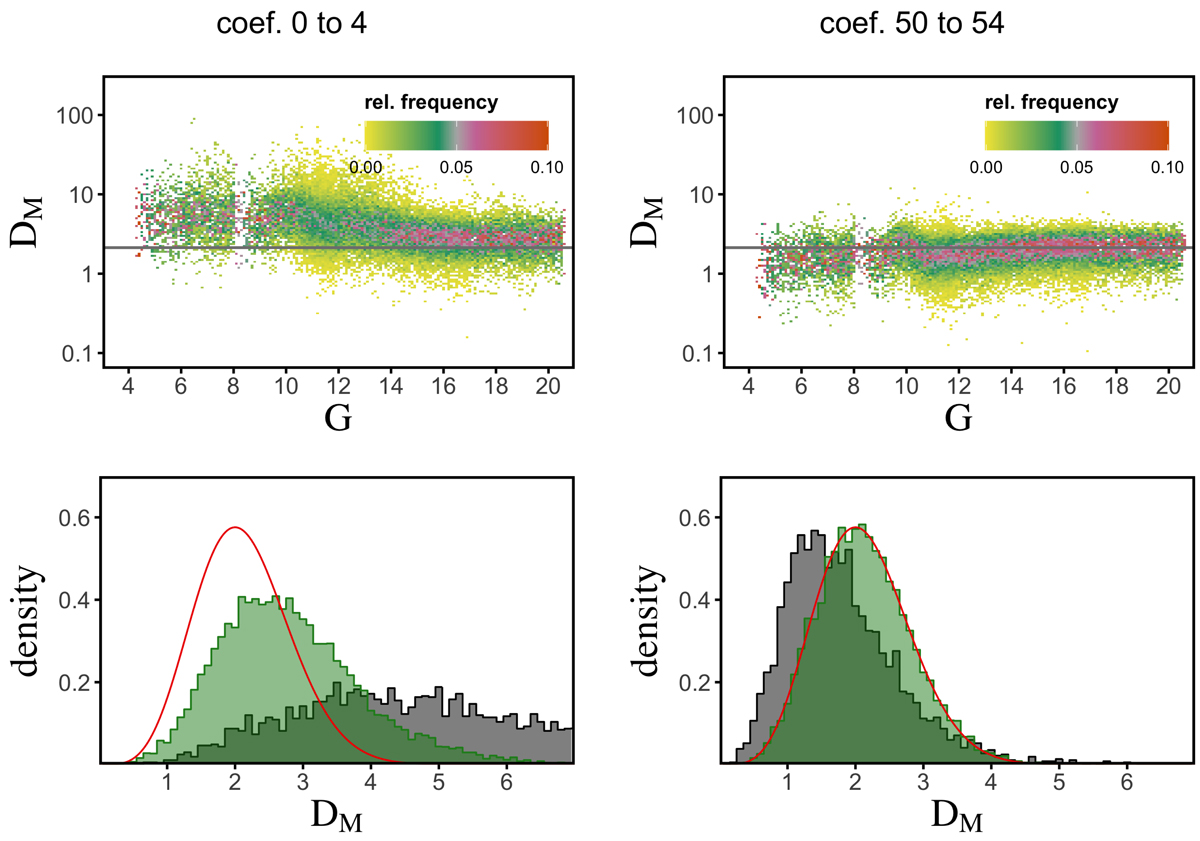
Top panels: distribution of the Mahalanobis distances of all test sources as a function of G-band magnitude. The grey horizontal line indicates the mean of the chi distribution. Bottom panels: histograms of the Mahalanobis distances for sources with G < 10 mag (grey) and G > 16 mag (green). The red line is the corresponding chi distribution. The left-hand side plots are for the first five coefficients, with indices 0–4, and the right-hand side plots are for the five coefficients of highest order, with indices 50–54.
Current usage metrics show cumulative count of Article Views (full-text article views including HTML views, PDF and ePub downloads, according to the available data) and Abstracts Views on Vision4Press platform.
Data correspond to usage on the plateform after 2015. The current usage metrics is available 48-96 hours after online publication and is updated daily on week days.
Initial download of the metrics may take a while.