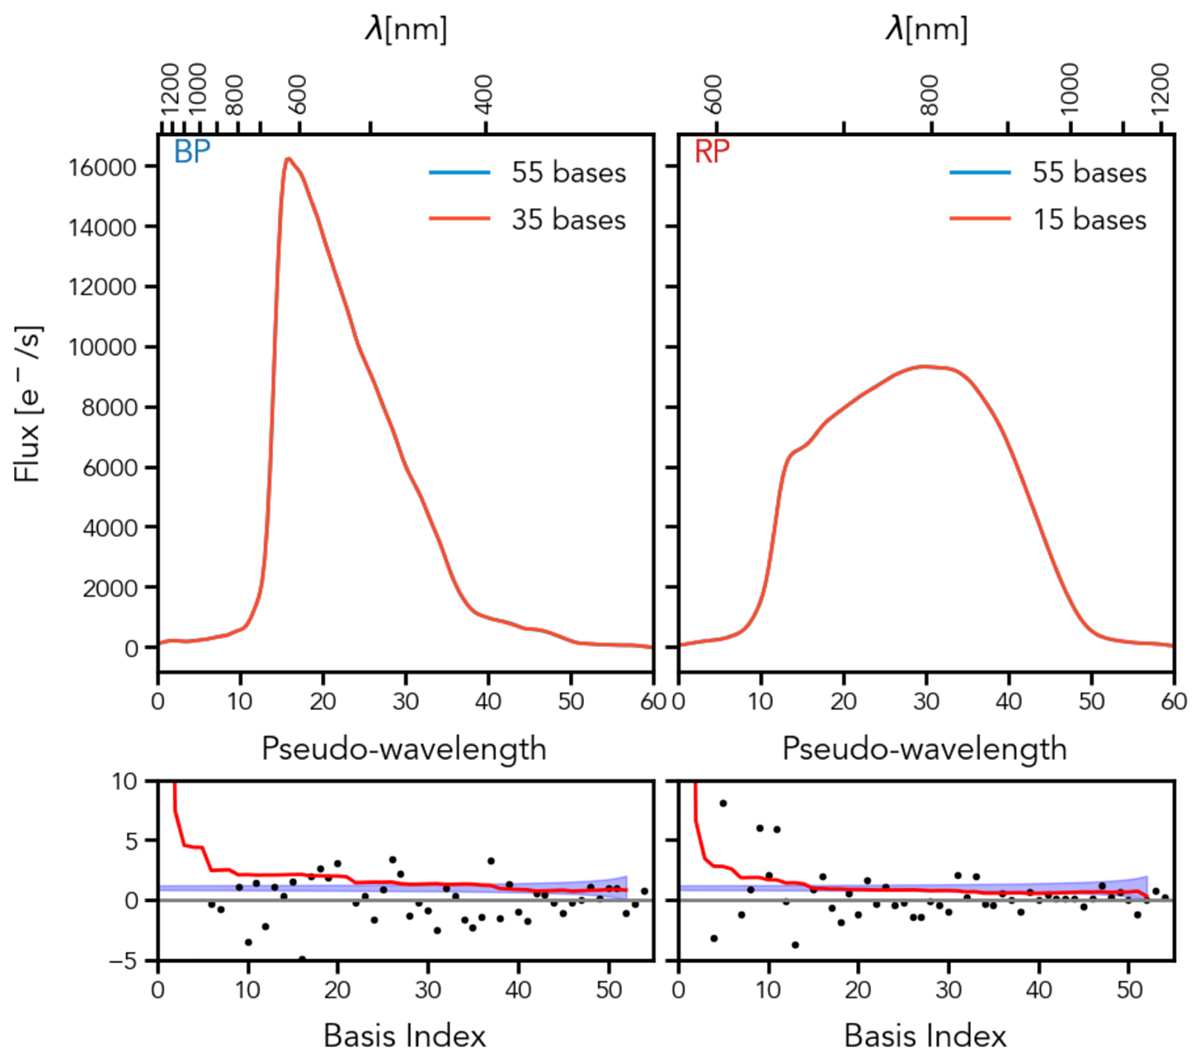
Fig. 14.
Download original image
Sampled BP (left) and RP (right) spectra are shown in the top panels for source Gaia DR3 6210089815971933056 (G ≈ 11.5 mag and GBP − GRP ≈ 1.0 mag). Each panel contains two curves: a blue curve showing the non-truncated spectrum using all 55 coefficients, and a red curve showing the truncated spectrum. The number of coefficients used for each spectrum is given in the label within the plot. The bottom panels show the truncation assessment. This is run independently for BP and RP. The black circles indicate the coefficients normalised by their formal errors, and the red line shows the standard deviation of the M normalised coefficients, starting from M = 3 on the right-hand side. The blue shaded region is the cone given by ![]() .
.
Current usage metrics show cumulative count of Article Views (full-text article views including HTML views, PDF and ePub downloads, according to the available data) and Abstracts Views on Vision4Press platform.
Data correspond to usage on the plateform after 2015. The current usage metrics is available 48-96 hours after online publication and is updated daily on week days.
Initial download of the metrics may take a while.