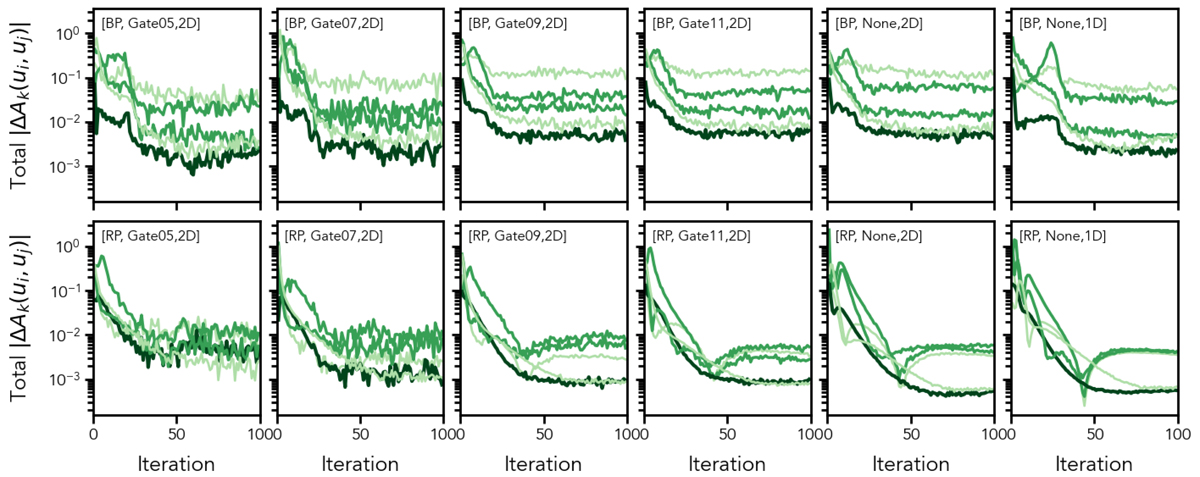
Fig. 11.
Download original image
Absolute relative change in the values of model parameters between two subsequent iterations for all solutions covering the OBMT-Rev range [3000, 4000] in a logarithmic scale. The relative change for each parameter is computed as the absolute difference between the values at two subsequent iterations, normalised by the value of the same parameter at the preceding iteration. Top panels: BP solutions, one panel per nominal combination of gate and window class. Bottom panels: RP solutions. Different colours indicate different values of the index j with the darkest line showing j = 0 and lighter colours being used for j = ±1 and j = ±2. The median value over the central part of the spectrum (25.0 < ui < 35.0) is plotted.
Current usage metrics show cumulative count of Article Views (full-text article views including HTML views, PDF and ePub downloads, according to the available data) and Abstracts Views on Vision4Press platform.
Data correspond to usage on the plateform after 2015. The current usage metrics is available 48-96 hours after online publication and is updated daily on week days.
Initial download of the metrics may take a while.