Fig. 9.
Download original image
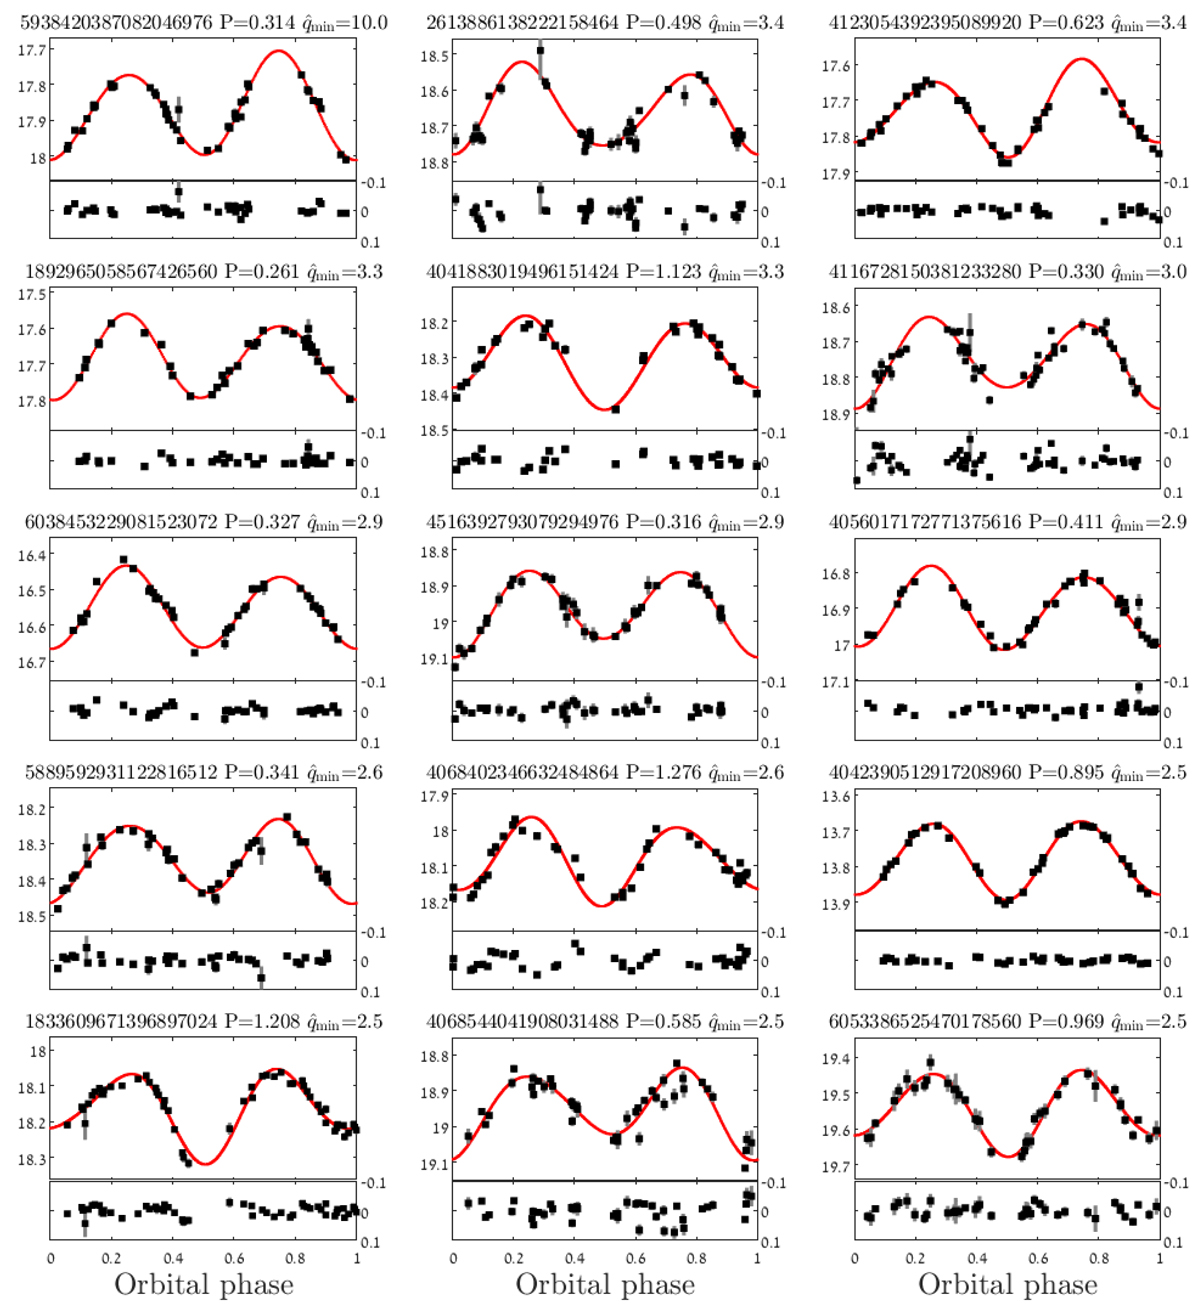
Folded Gaia light curves in the G band of the first 15 candidates with ![]() , in descending
, in descending ![]() order. For each candidate, the Gaia DR3 id is given, together with the Gaia period in days and the value of
order. For each candidate, the Gaia DR3 id is given, together with the Gaia period in days and the value of ![]() . The epoch of the second-harmonic minimum corresponds to phases 0 and 0.5, and a three-harmonics model is plotted with a solid red line. All curves are plotted with a mag range of 0.4 for convenience. The residuals are plotted in the lower panels and are shown between −0.1 and 0.1 mag for clarity. Marked identifiers are of Gaia DR3 4068402346632484864, which might be an RR Lyrae variable, discussed in Sect. 6, and Gaia DR3 4042390512917208960, which is one of our brightest candidates, discussed in Sect. 7.
. The epoch of the second-harmonic minimum corresponds to phases 0 and 0.5, and a three-harmonics model is plotted with a solid red line. All curves are plotted with a mag range of 0.4 for convenience. The residuals are plotted in the lower panels and are shown between −0.1 and 0.1 mag for clarity. Marked identifiers are of Gaia DR3 4068402346632484864, which might be an RR Lyrae variable, discussed in Sect. 6, and Gaia DR3 4042390512917208960, which is one of our brightest candidates, discussed in Sect. 7.
Current usage metrics show cumulative count of Article Views (full-text article views including HTML views, PDF and ePub downloads, according to the available data) and Abstracts Views on Vision4Press platform.
Data correspond to usage on the plateform after 2015. The current usage metrics is available 48-96 hours after online publication and is updated daily on week days.
Initial download of the metrics may take a while.