Fig. 6.
Download original image
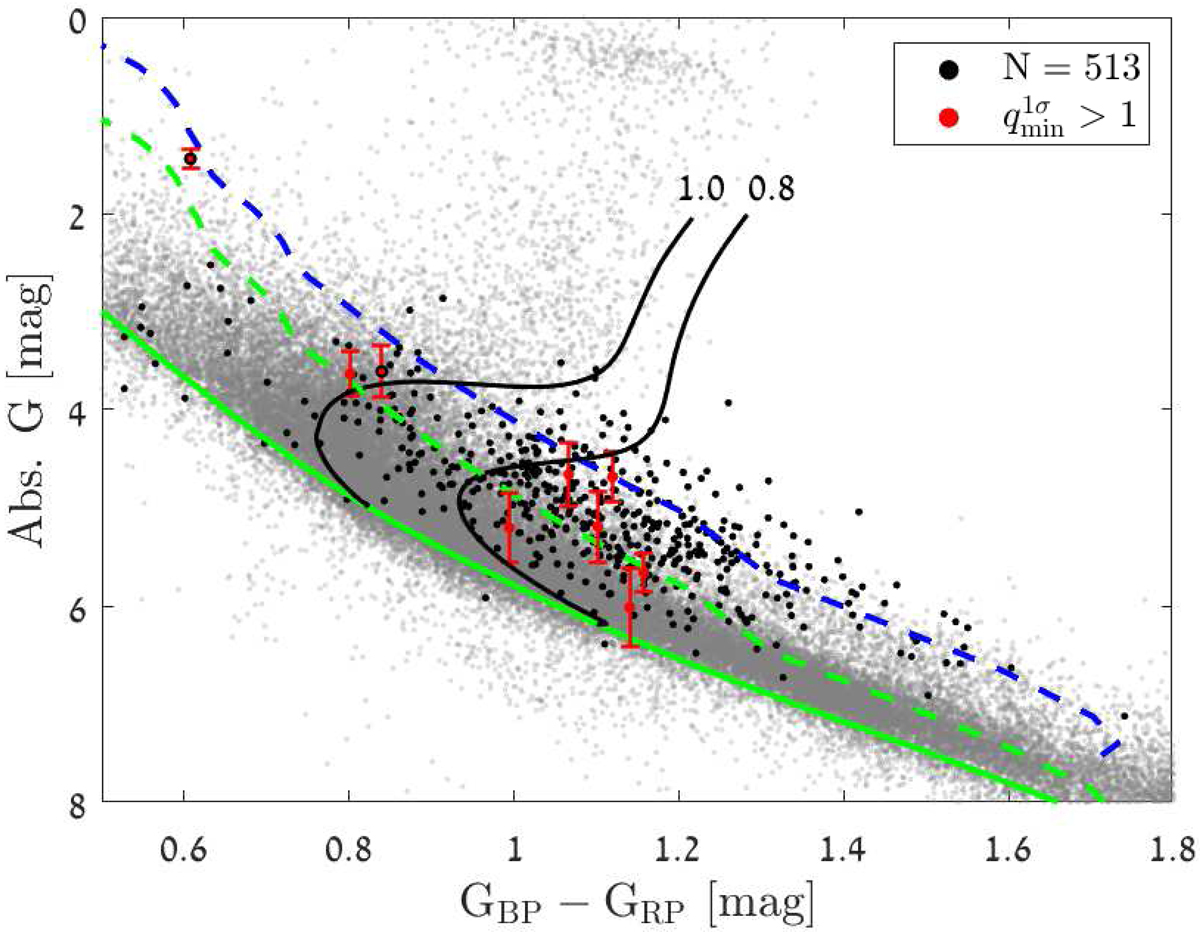
Compact companion candidates in the extinction-corrected Gaia CMD. Only 513 candidates with a minimum parallax of 0.5 mas and parallax-over-error > 5 are plotted. The background grey-scale density map of stars with a minimum parallax of 0.5 mas and a parallax-over-error > 10 serves as a proxy for the expected CMD. Magnitudes and extinction corrections for the candidates and the background stars are from Gaia DR3 data (Fouesneau et al. 2023). Nine systems with ![]() are plotted in red (see text). The two green curves mark the theoretical expected edges of the MS. The dashed blue curve is the theoretical upper G value expected for binaries with two identical MS stars, obtained by shifting the upper bound of the MS by 0.75 mag. We show the evolutionary tracks of 0.8 and 1 M⊙ stars within their MS phase in black. They were obtained with the ISOCHRONE3 software. The two sources DR3 4042390512917208960 (upper point) and DR3 4056017172771375616 (lower point) are discussed in Sect. 7 and are shown in red with a black edge.
are plotted in red (see text). The two green curves mark the theoretical expected edges of the MS. The dashed blue curve is the theoretical upper G value expected for binaries with two identical MS stars, obtained by shifting the upper bound of the MS by 0.75 mag. We show the evolutionary tracks of 0.8 and 1 M⊙ stars within their MS phase in black. They were obtained with the ISOCHRONE3 software. The two sources DR3 4042390512917208960 (upper point) and DR3 4056017172771375616 (lower point) are discussed in Sect. 7 and are shown in red with a black edge.
Current usage metrics show cumulative count of Article Views (full-text article views including HTML views, PDF and ePub downloads, according to the available data) and Abstracts Views on Vision4Press platform.
Data correspond to usage on the plateform after 2015. The current usage metrics is available 48-96 hours after online publication and is updated daily on week days.
Initial download of the metrics may take a while.