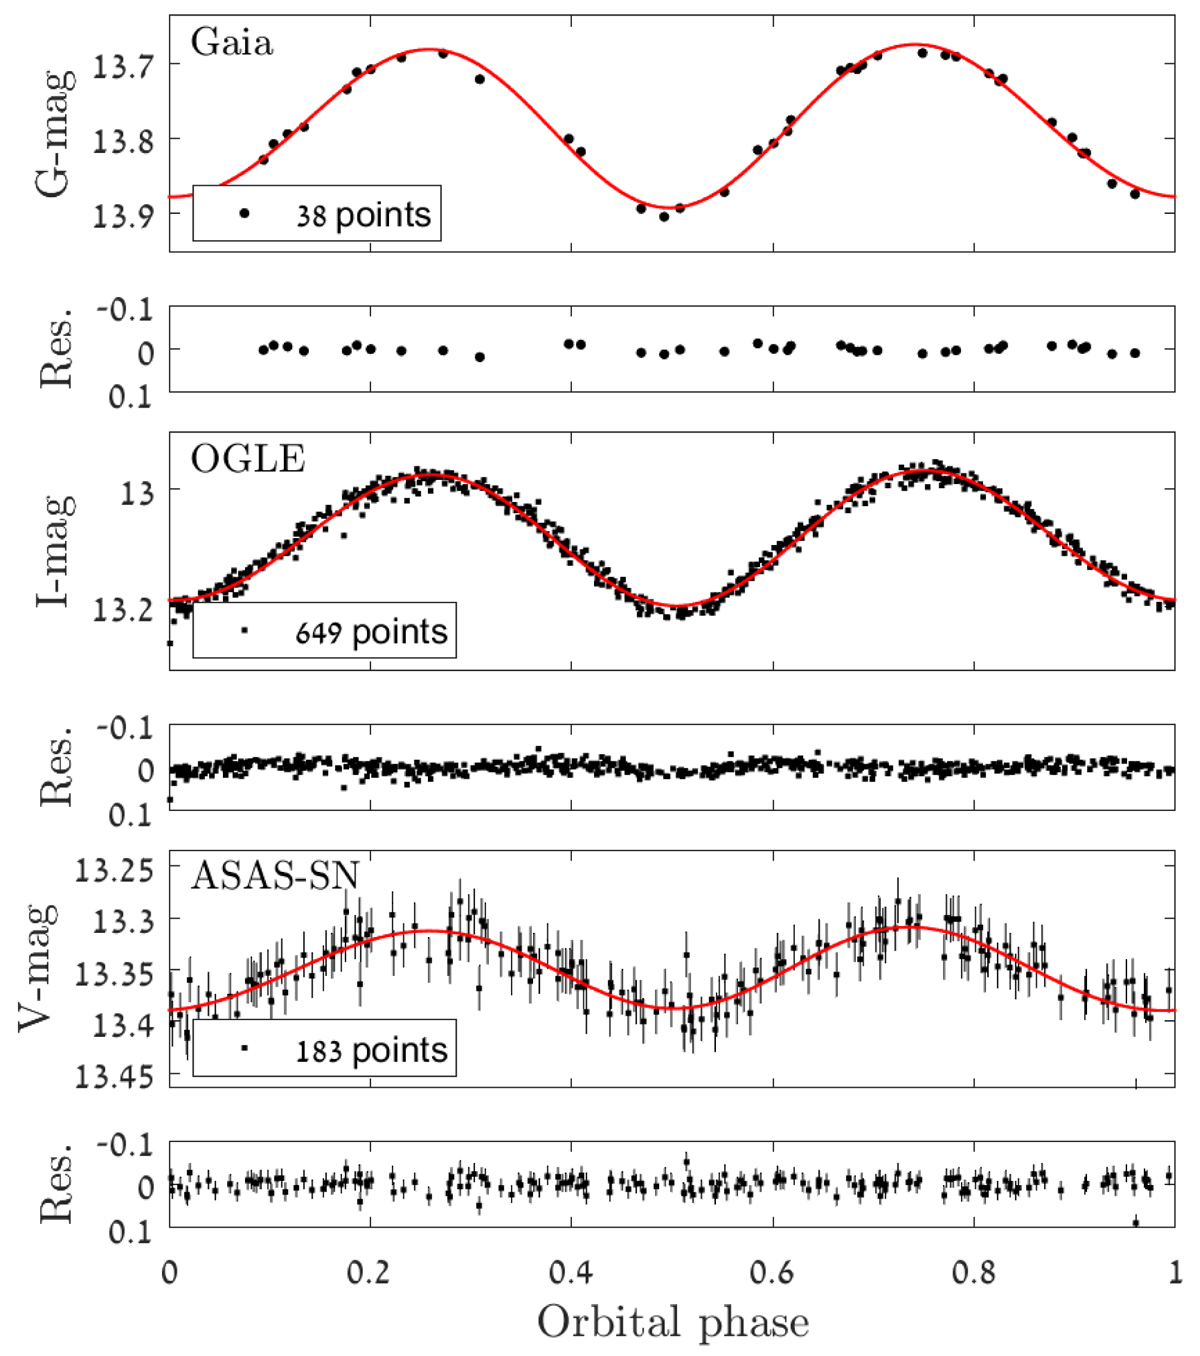
Fig. 10.
Download original image
Folded light curves of Gaia DR3 4042390512917208960 in the Gaia G (top panel), OGLE I (middle panel), and ASAS-SN V (bottom panel) bands. The orbital phase is calculated with a period of 0.89522 d and zero phase at BJD 2457581.3996, derived by the Gaia pipeline. A three-harmonics model is plotted with a solid line, and the residuals are plotted in the lower panel. The G- and I-band uncertainties, about 1 ppt, are too small to be shown.
Current usage metrics show cumulative count of Article Views (full-text article views including HTML views, PDF and ePub downloads, according to the available data) and Abstracts Views on Vision4Press platform.
Data correspond to usage on the plateform after 2015. The current usage metrics is available 48-96 hours after online publication and is updated daily on week days.
Initial download of the metrics may take a while.