Fig. 6.
Download original image
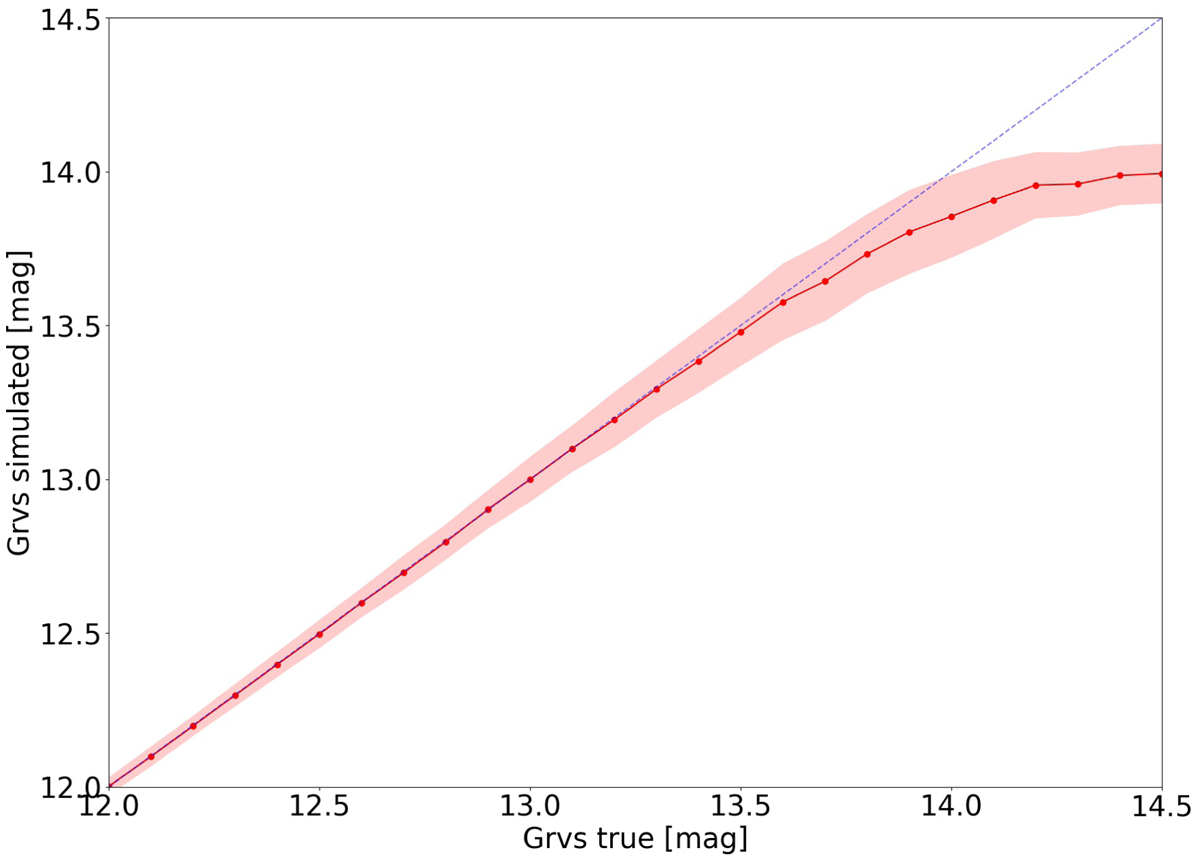
grvs_mag computed following the procedure outlined in Sect. 4.2, ![]() , plotted against true magnitude,
, plotted against true magnitude, ![]() , for the simulations described in Sect. 6. The red line shows the median relation from 1000 realisations, and the shaded area the associated error. The dashed blue line shows the identity relation. The estimated magnitude becomes systematically brighter than the true one for
, for the simulations described in Sect. 6. The red line shows the median relation from 1000 realisations, and the shaded area the associated error. The dashed blue line shows the identity relation. The estimated magnitude becomes systematically brighter than the true one for ![]() . The limiting magnitude of the stars processed for DR3 corresponds to
. The limiting magnitude of the stars processed for DR3 corresponds to ![]() .
.
Current usage metrics show cumulative count of Article Views (full-text article views including HTML views, PDF and ePub downloads, according to the available data) and Abstracts Views on Vision4Press platform.
Data correspond to usage on the plateform after 2015. The current usage metrics is available 48-96 hours after online publication and is updated daily on week days.
Initial download of the metrics may take a while.