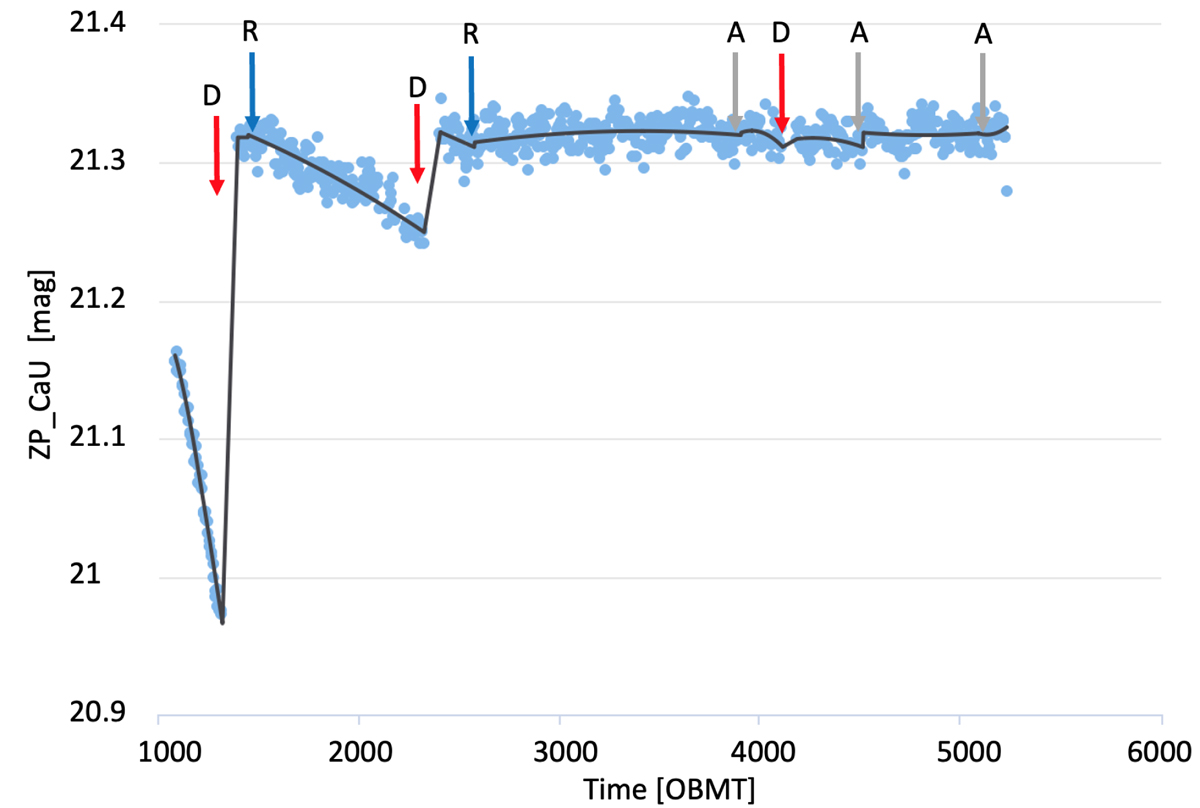
Fig. 3.
Download original image
GRVS zero-point plotted against OBMT. The blue points represent the ZPCaU estimates (from Eq. (3)) every 30 h for the CCD in row 6, strip 2, and FoV 2 (see Fig. 1 of Sartoretti et al. 2018) over the DR3 observing period. The black line is the calibration model for ZP(t). The arrows indicate break points between which the calibration model is fitted. The break points correspond to the following events: decontaminations (red arrows), refocus (blue arrows), and discontinuities in the astrometric solution (grey arrows). At the beginning of the mission, the Gaia optics suffered from heavy water ice contamination, which resulted in rapid degradation of the ZP. The first two decontamination events, at OBMT 1317 and 2330, produced a significant improvement in ZP. After the second decontamination event, the ZP stabilised, and the third decontamination event, which is also the last one performed on Gaia, resulted in no significant improvement. The other events have no significant effect on the ZP.
Current usage metrics show cumulative count of Article Views (full-text article views including HTML views, PDF and ePub downloads, according to the available data) and Abstracts Views on Vision4Press platform.
Data correspond to usage on the plateform after 2015. The current usage metrics is available 48-96 hours after online publication and is updated daily on week days.
Initial download of the metrics may take a while.