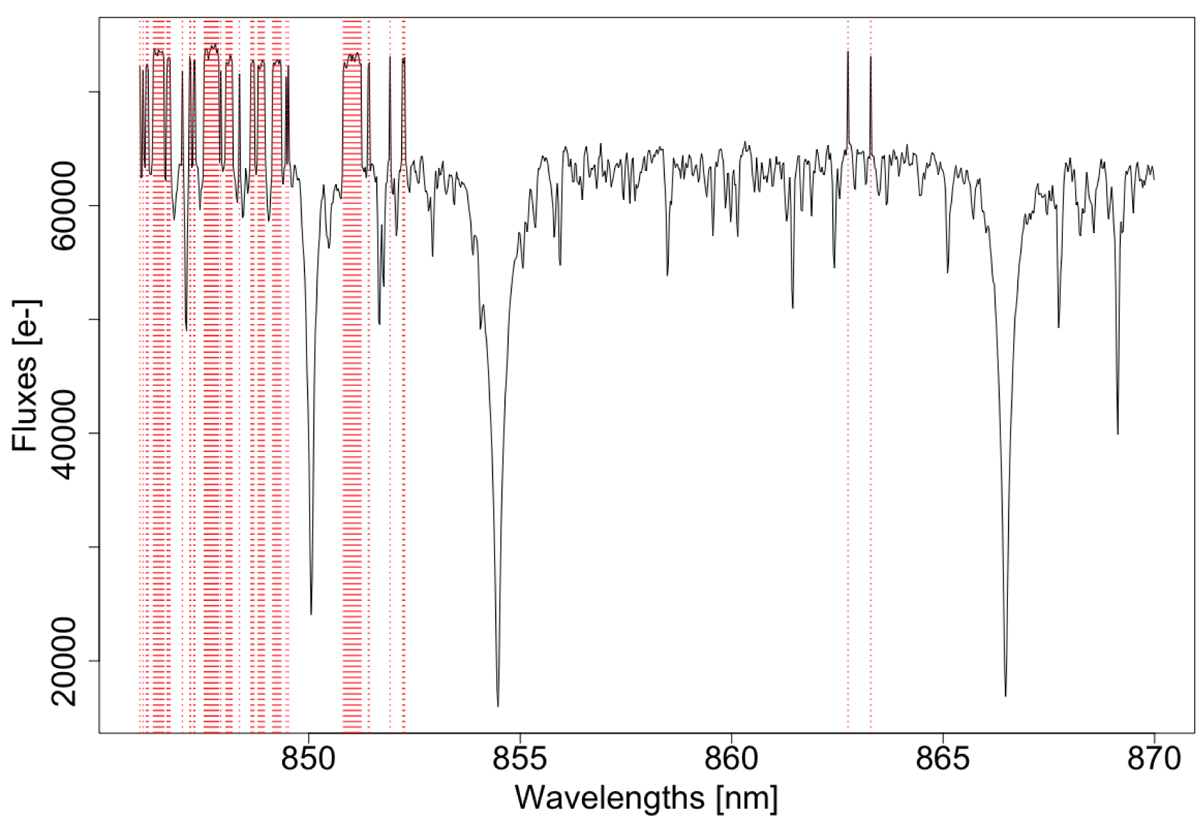
Fig. 2.
Download original image
Saturation in an RVS spectrum. The CCD spectrum shown (in units of e− per 4.4 s exposure) was obtained from the summing in the AC direction of a 2D-window spectrum including saturated AC-central pixels. The resulting 1D spectrum, which presents 99 saturated samples (marked in red), was discarded by the pipeline. The visible jumps (of ∼8000 e−) originate from AC-central pixels exceeding 50 000 ADU (see Sect. 3.1). The corresponding star has grvs_mag = 3.471 ± 0.005 mag, Teff = 4735 K, log g = 1.45, and [Fe/H] = −0.13.
Current usage metrics show cumulative count of Article Views (full-text article views including HTML views, PDF and ePub downloads, according to the available data) and Abstracts Views on Vision4Press platform.
Data correspond to usage on the plateform after 2015. The current usage metrics is available 48-96 hours after online publication and is updated daily on week days.
Initial download of the metrics may take a while.