Open Access
Fig. 16.
Download original image
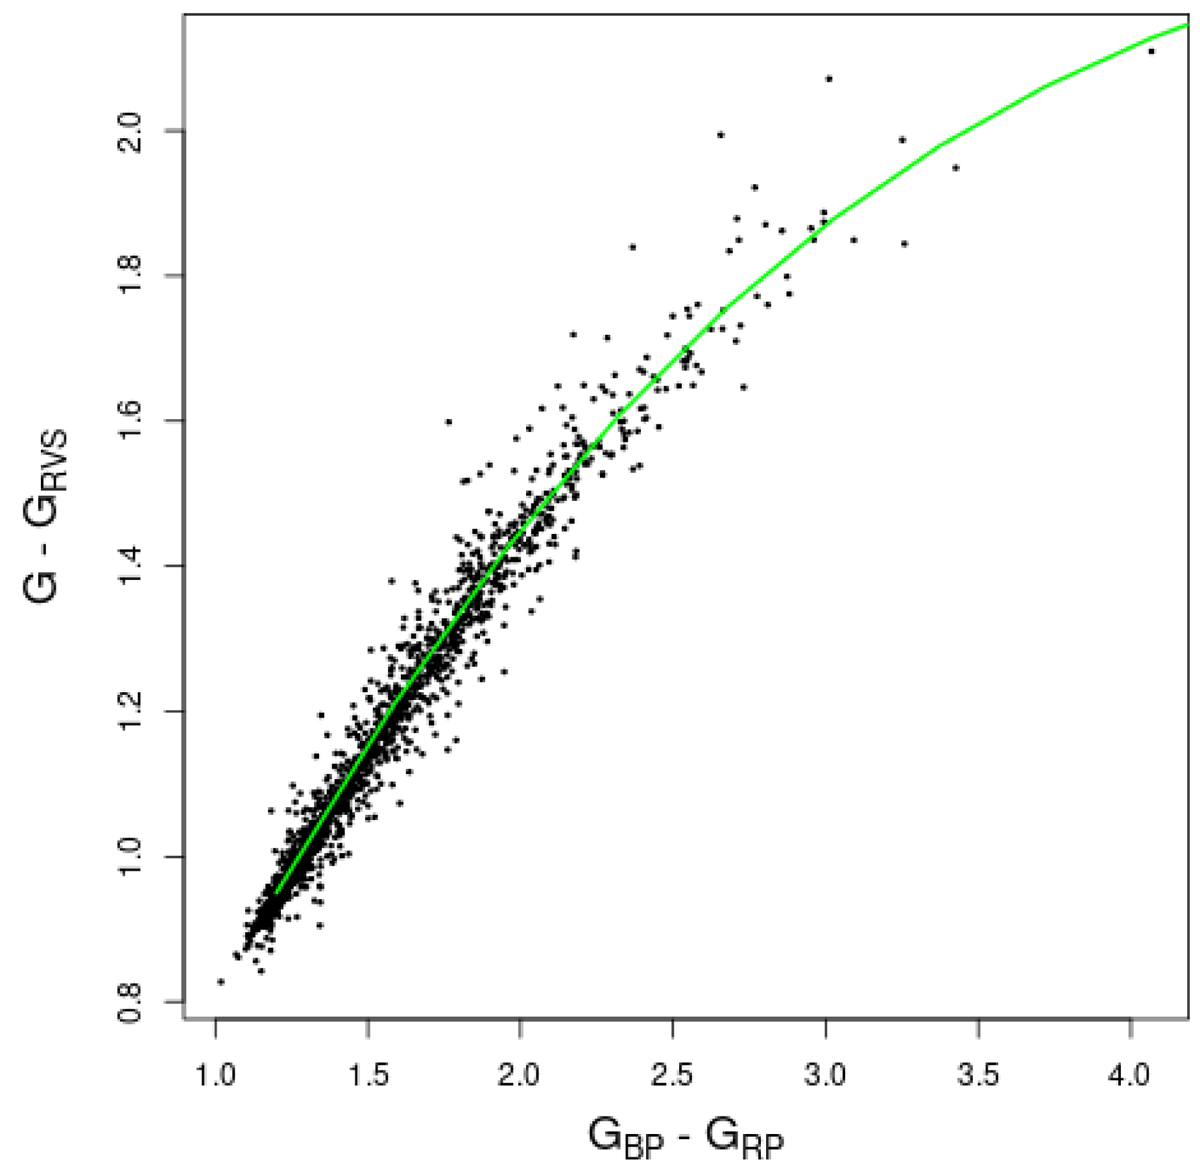
G − grvs_mag versus GBP − GRP colour–colour diagram of APOGEE DR16 Red Clump stars with similar metallicity. The green line shows the expected red clump star colour–colour relation driven by extinction, as computed using the Fitzpatrick et al. (2019) extinction law.
Current usage metrics show cumulative count of Article Views (full-text article views including HTML views, PDF and ePub downloads, according to the available data) and Abstracts Views on Vision4Press platform.
Data correspond to usage on the plateform after 2015. The current usage metrics is available 48-96 hours after online publication and is updated daily on week days.
Initial download of the metrics may take a while.