Open Access
Fig. 14.
Download original image
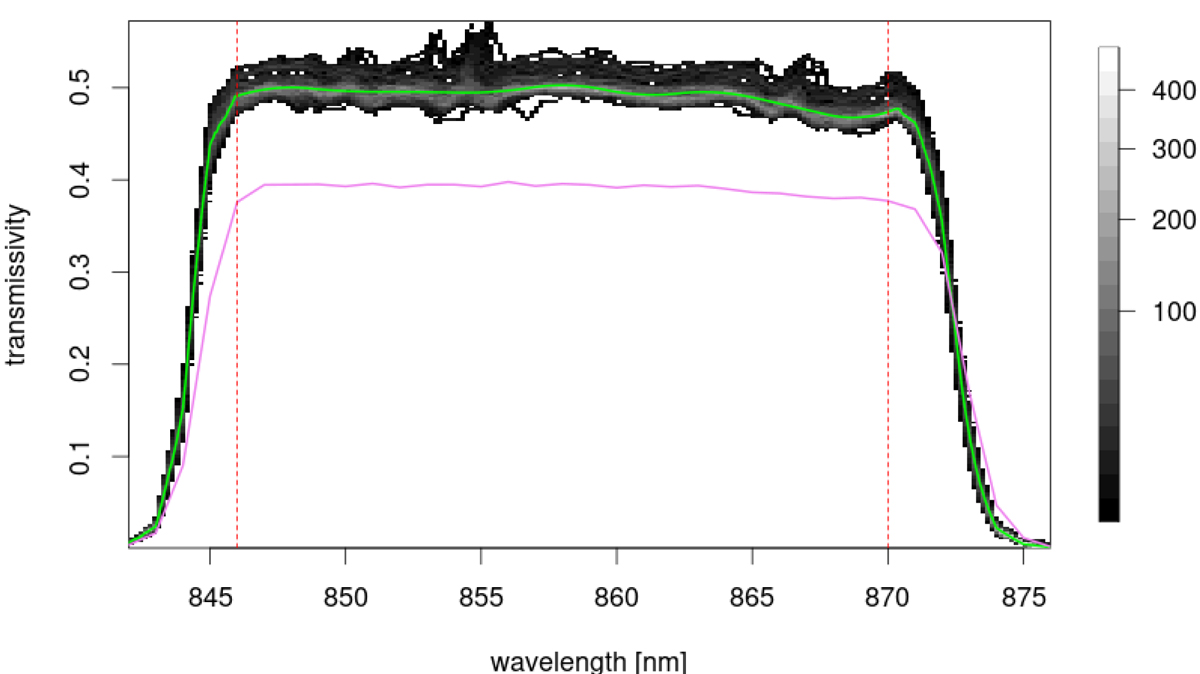
Global RVS transmission function S(λ) (green line) corresponding to the median of 108 estimates derived from reference spectra (shown in the background with a grey scale indicating curve density). The purple curve shows the nominal pre-launch transmission, and the two red vertical lines the limits of the GRVS passband.
Current usage metrics show cumulative count of Article Views (full-text article views including HTML views, PDF and ePub downloads, according to the available data) and Abstracts Views on Vision4Press platform.
Data correspond to usage on the plateform after 2015. The current usage metrics is available 48-96 hours after online publication and is updated daily on week days.
Initial download of the metrics may take a while.