Fig. 11.
Download original image
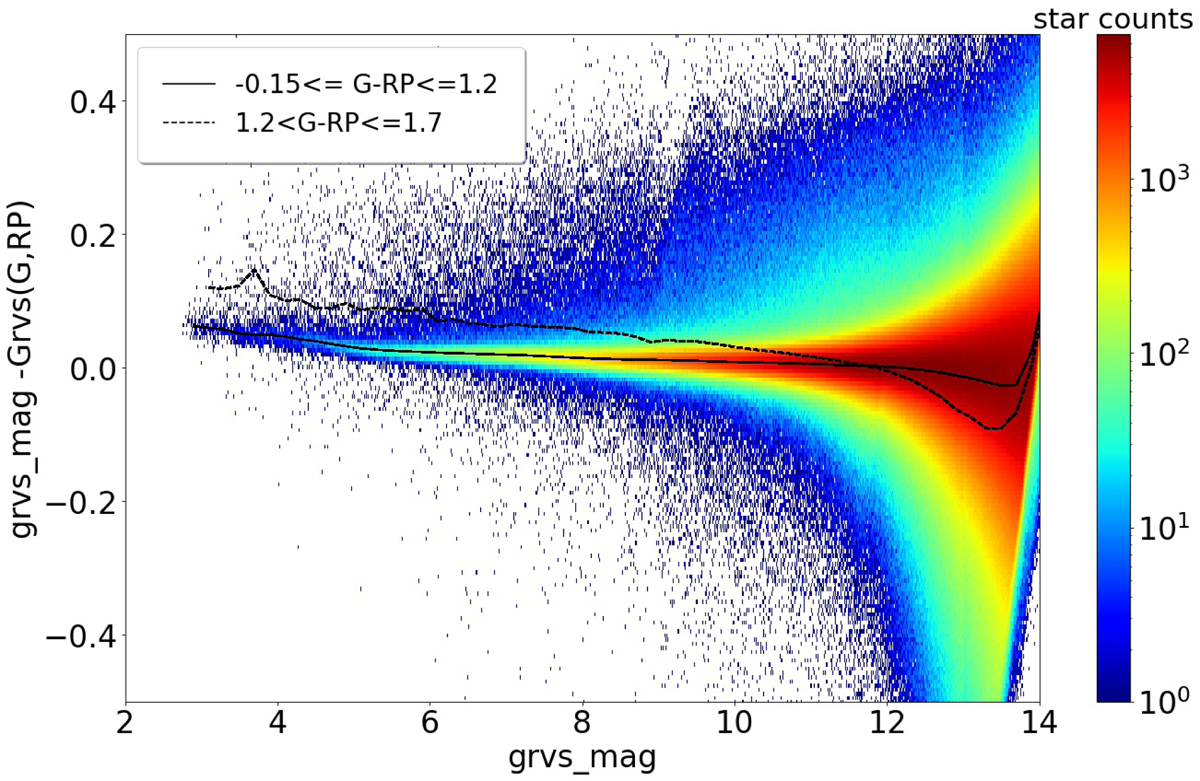
![]() residuals plotted against grvs_mag. The black solid line shows the median residuals in bins of Δ(grvs_mag)=0.1 mag for stars with blue G − GRP colours (−0.15 ≤ G − GRP ≤ 1.2 mag; Eq. (9)), and the black dashed line the median residuals for stars with red G − GRP colours (1.2 < G − GRP ≤ 1.7; Eq. (10)). The
residuals plotted against grvs_mag. The black solid line shows the median residuals in bins of Δ(grvs_mag)=0.1 mag for stars with blue G − GRP colours (−0.15 ≤ G − GRP ≤ 1.2 mag; Eq. (9)), and the black dashed line the median residuals for stars with red G − GRP colours (1.2 < G − GRP ≤ 1.7; Eq. (10)). The ![]() mag selection criterion to measure grvs_mag (Sect. 2.3) translates into a cut at
mag selection criterion to measure grvs_mag (Sect. 2.3) translates into a cut at ![]() in this diagram, resulting in the apparent rise of the median residuals at the faint end.
in this diagram, resulting in the apparent rise of the median residuals at the faint end.
Current usage metrics show cumulative count of Article Views (full-text article views including HTML views, PDF and ePub downloads, according to the available data) and Abstracts Views on Vision4Press platform.
Data correspond to usage on the plateform after 2015. The current usage metrics is available 48-96 hours after online publication and is updated daily on week days.
Initial download of the metrics may take a while.