Fig. E.1.
Download original image
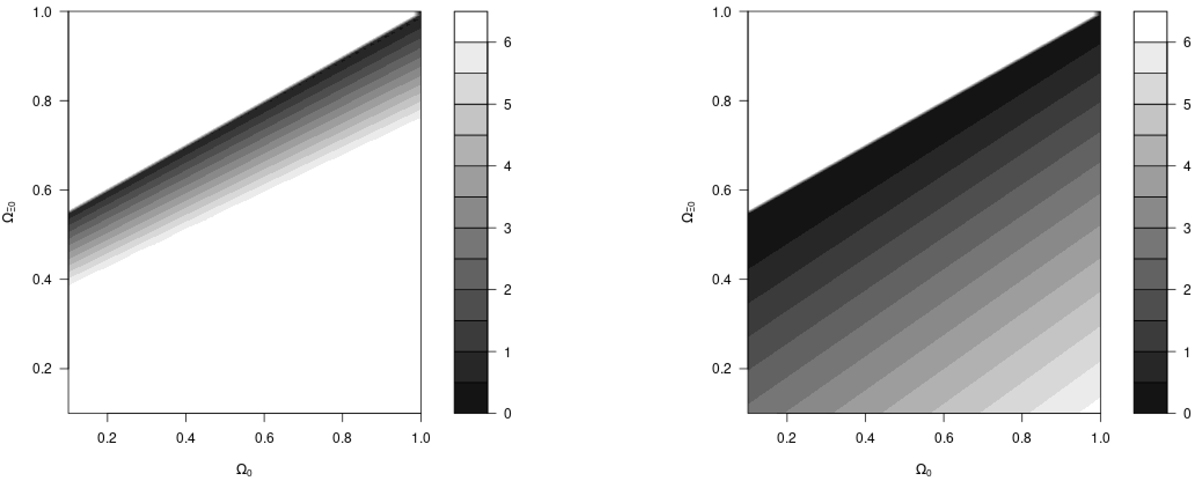
Function ![]() , the difference between
, the difference between ![]() (Eq. E.1) and its minimum value, for the CRG+ (left panel) and the CRG– (right panel) solutions. Under the assumption of Gaussian random errors, the 68%, 90%, 95%, and 99% confidence regions of the two parameters are the area where Δ(Ω0, ΩΞ0) < 2.3, 4.6, 6.2, and 9.2, respectively. The 90% confidence regions are thus 0.43 + 0.44Ω0 ≲ ΩΞ0 ≤ 0.5(1 + Ω0) for the CRG+ solution and max{0, ( − 0.26 + 0.63Ω0)} ≲ ΩΞ0 ≤ 0.5(1 + Ω0) for the CRG– solution. In the two panels, there are no solutions in the white top left area. For the CRG+ solution shown in the left panel, for an easier comparison with the CRG– solution shown in the right panel, Δ(Ω0, ΩΞ0) is not reported in the white bottom right area where Δ > 7.
(Eq. E.1) and its minimum value, for the CRG+ (left panel) and the CRG– (right panel) solutions. Under the assumption of Gaussian random errors, the 68%, 90%, 95%, and 99% confidence regions of the two parameters are the area where Δ(Ω0, ΩΞ0) < 2.3, 4.6, 6.2, and 9.2, respectively. The 90% confidence regions are thus 0.43 + 0.44Ω0 ≲ ΩΞ0 ≤ 0.5(1 + Ω0) for the CRG+ solution and max{0, ( − 0.26 + 0.63Ω0)} ≲ ΩΞ0 ≤ 0.5(1 + Ω0) for the CRG– solution. In the two panels, there are no solutions in the white top left area. For the CRG+ solution shown in the left panel, for an easier comparison with the CRG– solution shown in the right panel, Δ(Ω0, ΩΞ0) is not reported in the white bottom right area where Δ > 7.
Current usage metrics show cumulative count of Article Views (full-text article views including HTML views, PDF and ePub downloads, according to the available data) and Abstracts Views on Vision4Press platform.
Data correspond to usage on the plateform after 2015. The current usage metrics is available 48-96 hours after online publication and is updated daily on week days.
Initial download of the metrics may take a while.