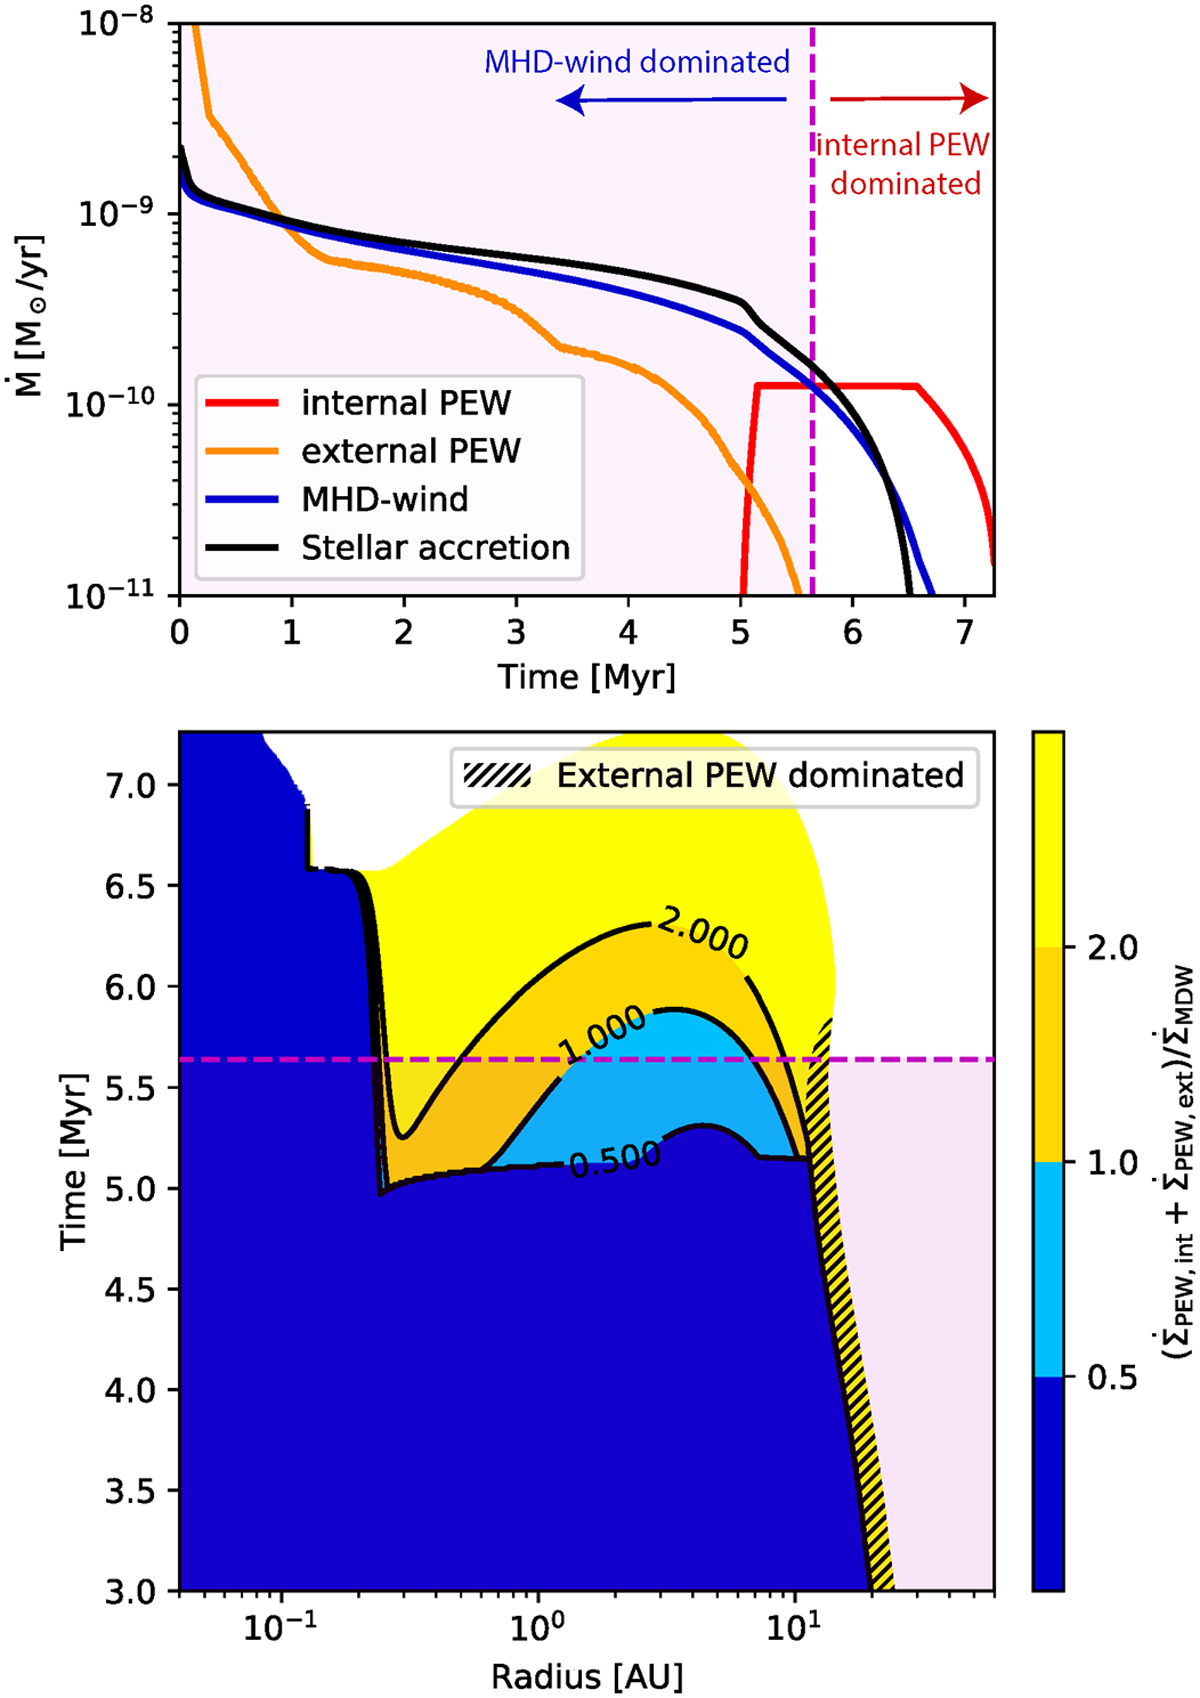
Fig. 9
Download original image
Relative importance of different mass-loss processes for the exemplary case with weak DW, strong constant torque and ℱFUV = 10 G0 (bottom row of Fig. 3). Top: time evolution of mass-loss rates for different processes. Purple dashed line distinguishes MHD-wind dominated and internal PEW dominated period (analogous to Fig. 2c in Kunitomo et al. 2020). Bottom: ratios of Σ for different mass loss processes shown for radial extend and time. Blue areas are dominated by MHD-wind while yellow areas indicate PEW dominated. The hatched area highlight external PEW-dominated regions.
Current usage metrics show cumulative count of Article Views (full-text article views including HTML views, PDF and ePub downloads, according to the available data) and Abstracts Views on Vision4Press platform.
Data correspond to usage on the plateform after 2015. The current usage metrics is available 48-96 hours after online publication and is updated daily on week days.
Initial download of the metrics may take a while.