Fig. B.2
Download original image
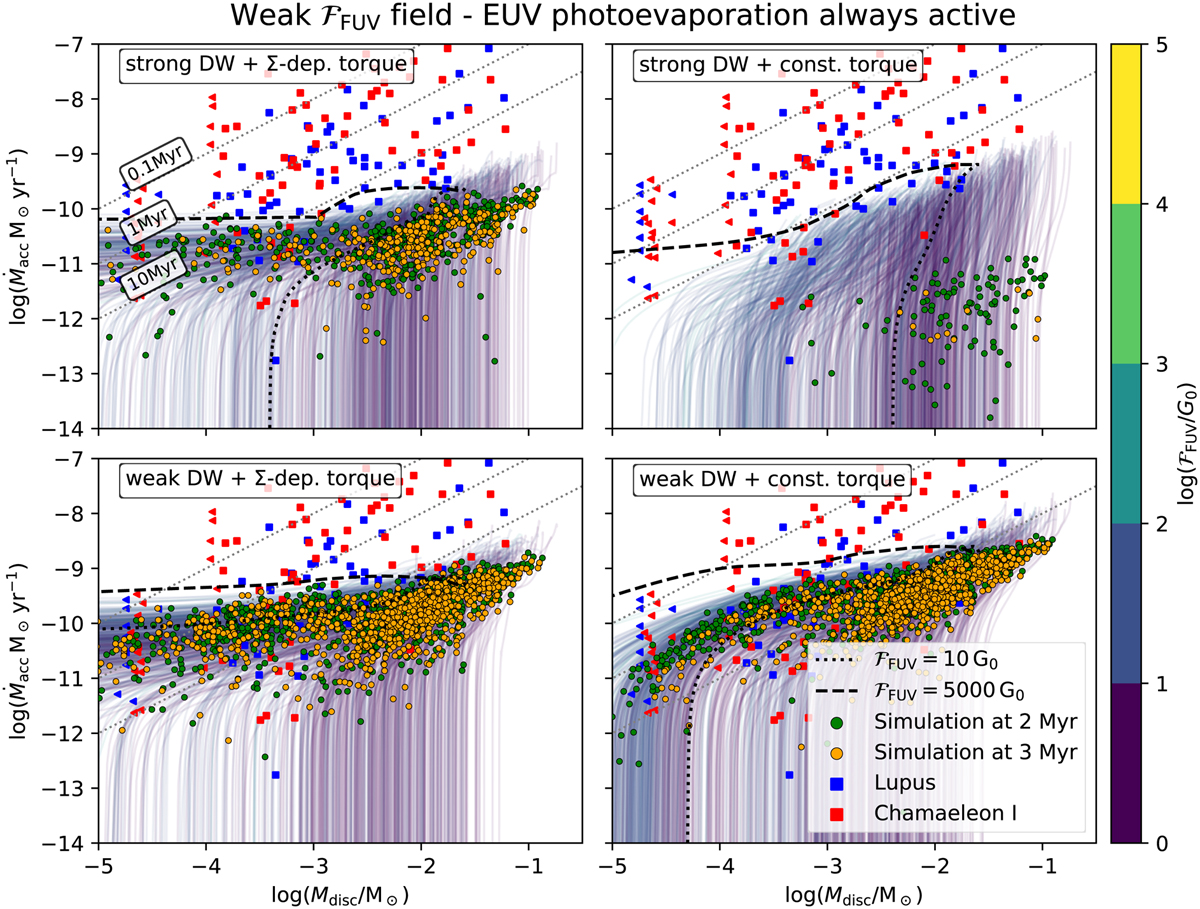
Stellar accretion rate ![]() vs. gas disc mass Mdisc, analogous to Fig. 5, but without EUV radiation shielding. Exemplary cases are the same as in Figs. 3 and 4, but without EUV radiation shielding. Snapshots at 2 Myr (green circles) and 3 Myr (orange circles) are displayed. We compare our simulations with observed populations in Lupus and Chamaeleon I. Observational dust disc masses and stellar accretion rates are taken from Manara et al. (2019) and dust masses are converted to gas masses by assuming the standard dust-to-gas ratio of 0.01. Triangles denote upper limits on disc mass. Lines of constant
vs. gas disc mass Mdisc, analogous to Fig. 5, but without EUV radiation shielding. Exemplary cases are the same as in Figs. 3 and 4, but without EUV radiation shielding. Snapshots at 2 Myr (green circles) and 3 Myr (orange circles) are displayed. We compare our simulations with observed populations in Lupus and Chamaeleon I. Observational dust disc masses and stellar accretion rates are taken from Manara et al. (2019) and dust masses are converted to gas masses by assuming the standard dust-to-gas ratio of 0.01. Triangles denote upper limits on disc mass. Lines of constant ![]() are shown for 0.1, 1 and 10 Myr (thin dotted lines).
are shown for 0.1, 1 and 10 Myr (thin dotted lines).
Current usage metrics show cumulative count of Article Views (full-text article views including HTML views, PDF and ePub downloads, according to the available data) and Abstracts Views on Vision4Press platform.
Data correspond to usage on the plateform after 2015. The current usage metrics is available 48-96 hours after online publication and is updated daily on week days.
Initial download of the metrics may take a while.