Fig. 7.
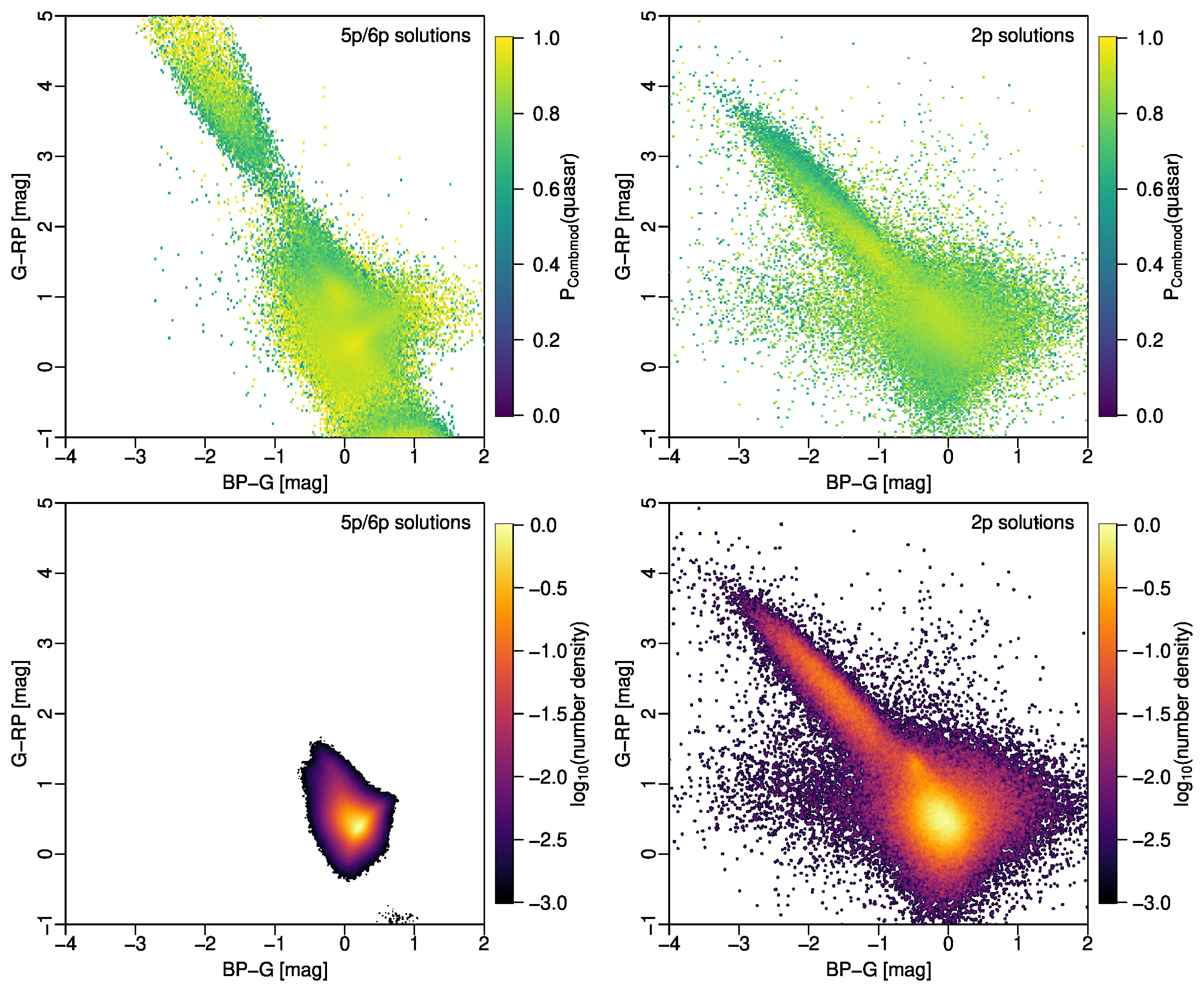
Download original image
Colour–colour diagram for sources in the qso_candidates table with classlabel_dsc=‘quasar’, excluding regions around the LMC and SMC. The left column shows sources with 5p/6p solutions (2.64 million sources), the right column shows sources with 2p solutions (0.14 million sources). These numbers refer to plotted sources, i.e. that have all Gaia bands. The colour coding in the upper panel shows the mean DSC-Combmod probability for the quasar class (the field classprob_dsc_combmod_quasar). The colour coding in the lower panel shows the density of sources on a log scale relative to the peak density in that panel.
Current usage metrics show cumulative count of Article Views (full-text article views including HTML views, PDF and ePub downloads, according to the available data) and Abstracts Views on Vision4Press platform.
Data correspond to usage on the plateform after 2015. The current usage metrics is available 48-96 hours after online publication and is updated daily on week days.
Initial download of the metrics may take a while.