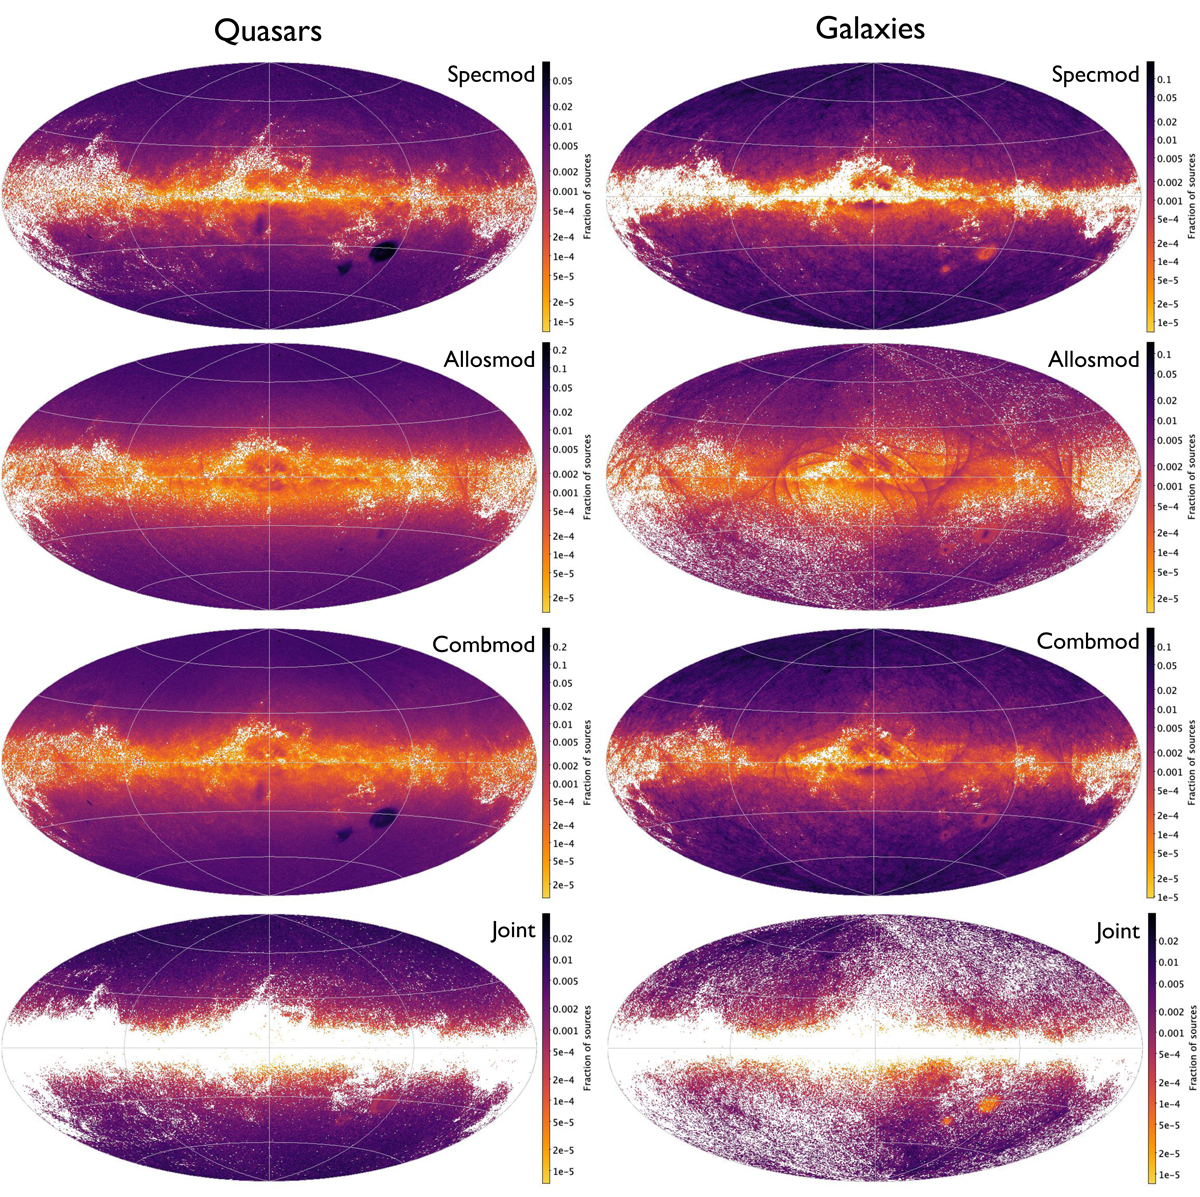
Fig. 6.
Download original image
Galactic sky distribution of the fraction of DSC sources classified as quasars (left) and galaxies (right) according to Specmod (top), Allosmod (second), Combmod (third), and Specmod and Allosmod (bottom) probabilities being greater than 0.5 for that class. Bottom two rows are identical to classlabel_dsc and classlabel_dsc_joint (respectively) being set to the appropriate class (see Sect. 3.2.4). The plot is shown at HEALPix level 7 (0.210 deg2) with each cell showing the ratio of the sources classified to the total number of sources with DSC results (1.59 billion over the whole sky). The logarithmic colour scale covers the full range for each panel, and is therefore different for each panel.
Current usage metrics show cumulative count of Article Views (full-text article views including HTML views, PDF and ePub downloads, according to the available data) and Abstracts Views on Vision4Press platform.
Data correspond to usage on the plateform after 2015. The current usage metrics is available 48-96 hours after online publication and is updated daily on week days.
Initial download of the metrics may take a while.