Fig. 21.
Download original image
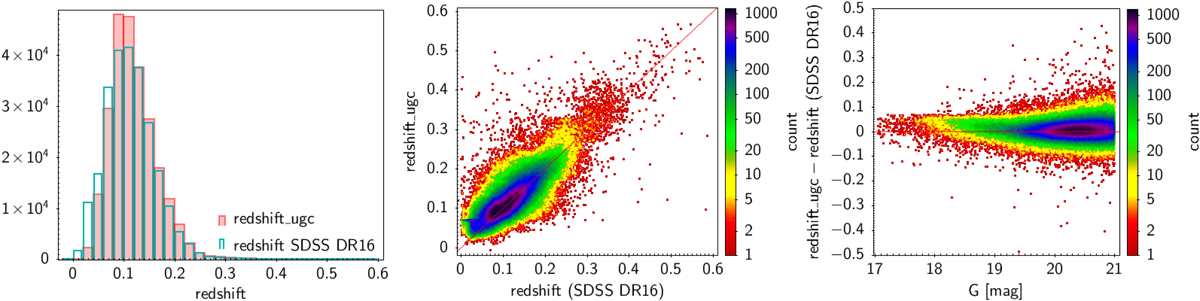
Comparison of the UGC estimated and the actual (SDSS DR16) redshifts for the 248 356 sources in common (not shown are 67 sources with actual redshift greater than 0.6). Left panel: distributions of the UGC redshifts and SDSS DR16 redshifts indicates that UGC tends to overestimate the small redshifts. Middle panel: comparison of the UGC redshifts and SDSS DR16 redshifts. The unit line is shown in red. A small horizontal branch at redshift_ugc = 0.07 is discussed in the text. Right panel: differences between the UGC and SDSS DR16 redshifts as a function of G magnitude. The red horizontal line designates perfect agreement.
Current usage metrics show cumulative count of Article Views (full-text article views including HTML views, PDF and ePub downloads, according to the available data) and Abstracts Views on Vision4Press platform.
Data correspond to usage on the plateform after 2015. The current usage metrics is available 48-96 hours after online publication and is updated daily on week days.
Initial download of the metrics may take a while.