Open Access
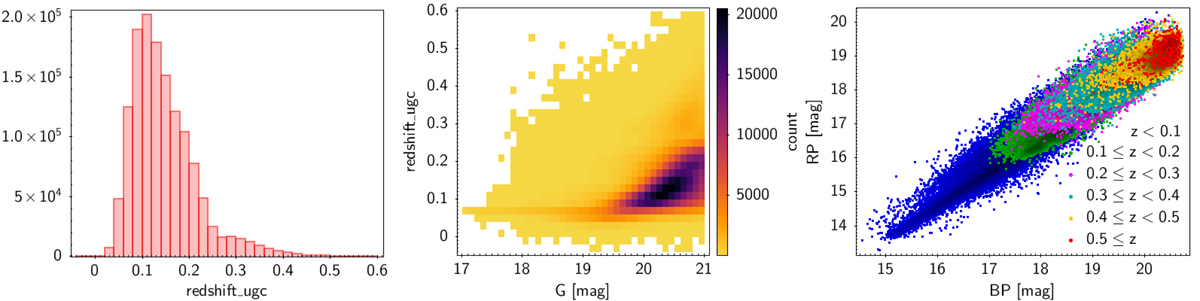
Fig. 20.
Download original image
Distribution of the UGC redshifts. Left: histogram of the estimated redshift in bins of size 0.02. Middle: UGC redshifts as a function of G magnitude. Right: distribution of the sources with UGC redshifts on a BP/RP magnitude diagram where different colours correspond to different redshift ranges.
Current usage metrics show cumulative count of Article Views (full-text article views including HTML views, PDF and ePub downloads, according to the available data) and Abstracts Views on Vision4Press platform.
Data correspond to usage on the plateform after 2015. The current usage metrics is available 48-96 hours after online publication and is updated daily on week days.
Initial download of the metrics may take a while.