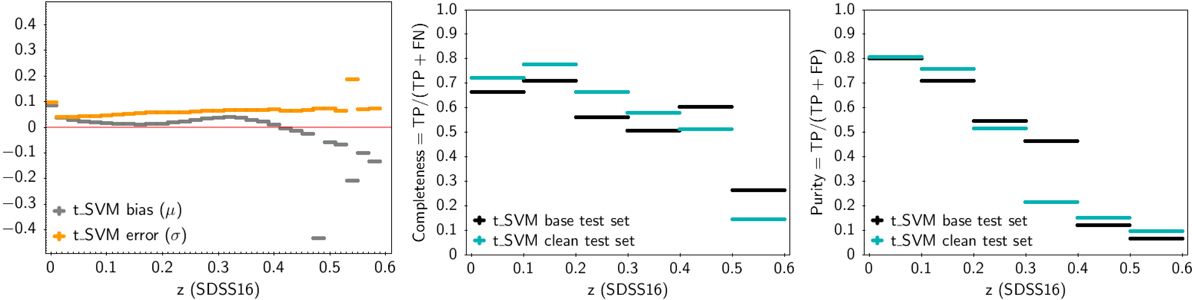
Fig. 18.
Download original image
Left panel: mean (μi) and standard deviation (σi) of the difference between the UGC redshifts, from the t-SVM model, and associated SDSS redshifts for sources contained in the UGC base test set and averaged over redshift bins of size 0.02. Completeness (middle panel) and purity (right panel) as a function of redshift, evaluated on the UGC test set (black) and clean set (cyan). The bin size is equal to 0.1.
Current usage metrics show cumulative count of Article Views (full-text article views including HTML views, PDF and ePub downloads, according to the available data) and Abstracts Views on Vision4Press platform.
Data correspond to usage on the plateform after 2015. The current usage metrics is available 48-96 hours after online publication and is updated daily on week days.
Initial download of the metrics may take a while.