Open Access
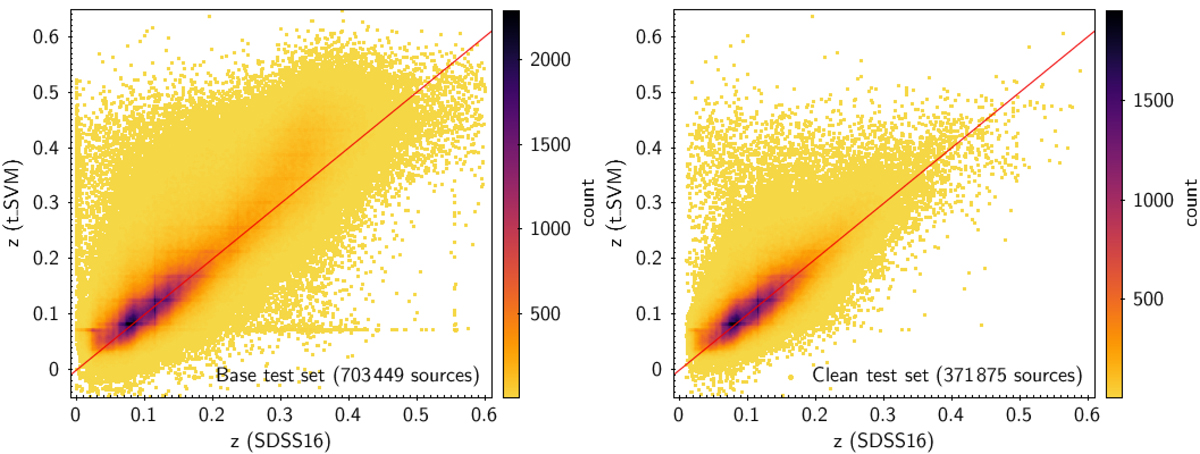
Fig. 17.
Download original image
Comparison of the UGC redshifts, as estimated from the t-SVM model with SDSS DR16 redshifts for the base test set (left) and for the clean test set (right), as identified in Sect. 6.2.1.
Current usage metrics show cumulative count of Article Views (full-text article views including HTML views, PDF and ePub downloads, according to the available data) and Abstracts Views on Vision4Press platform.
Data correspond to usage on the plateform after 2015. The current usage metrics is available 48-96 hours after online publication and is updated daily on week days.
Initial download of the metrics may take a while.