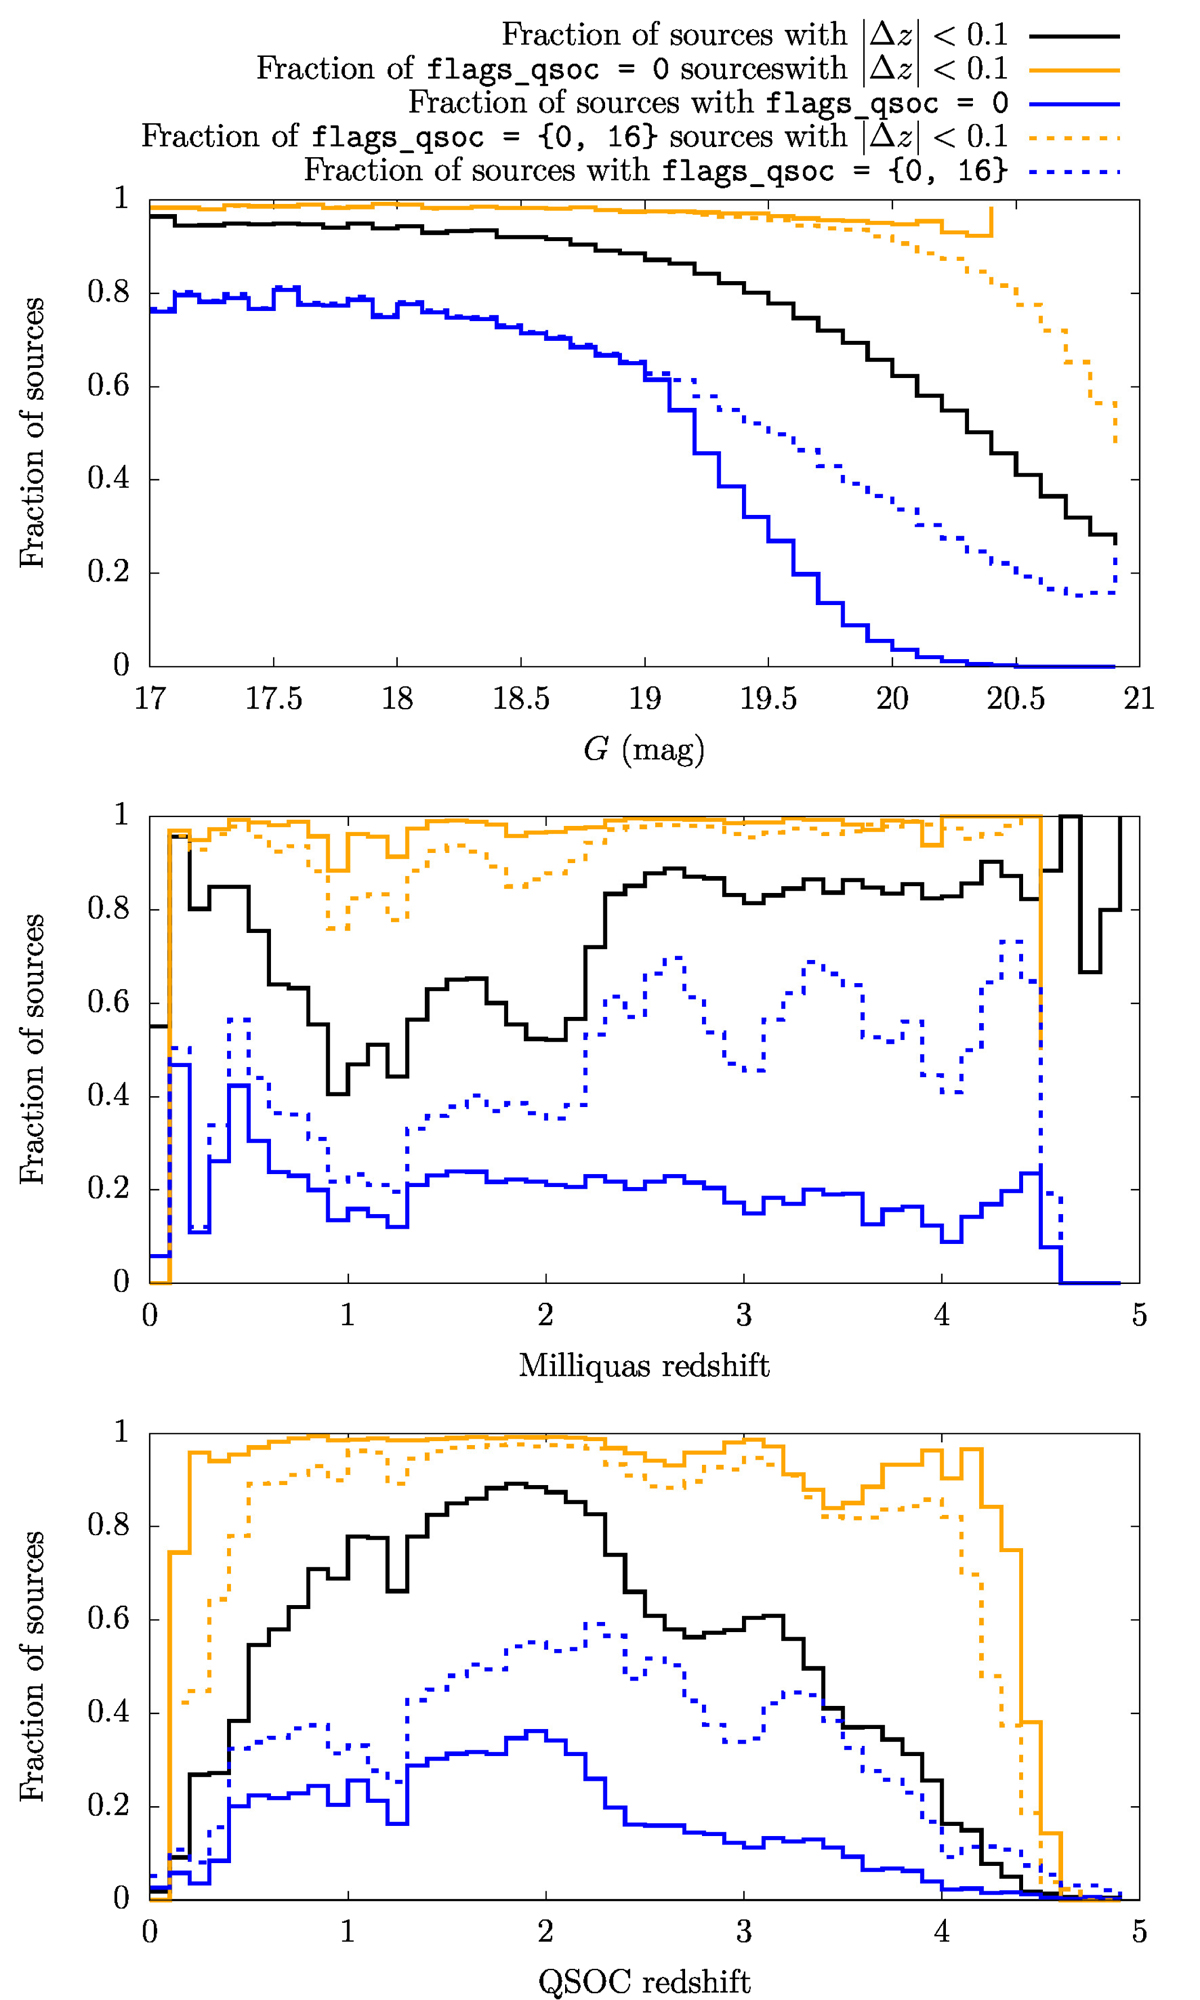
Fig. 16.
Download original image
Fraction of successful and reliable QSOC predictions computed over 439 127 sources contained in the Milliquas 7.2 catalogue with respect to G magnitude (top), Milliquas redshift (middle), and QSOC redshift (bottom). Black line: Fraction of observations with an absolute error of the predicted redshift, |Δz|, lower than 0.1. Orange line: Fraction of flags_qsoc = 0 sources with |Δz|< 0.1. Blue line: Fraction of observations with flags_qsoc = 0. Orange and blue dotted lines correspond to their solid counterpart while considering (flags_qsoc = 0 or flags_qsoc = 16) observations instead of flags_qsoc = 0 observations. Fractions are computed with respect to the number of sources in magnitude and redshift bins of 0.1.
Current usage metrics show cumulative count of Article Views (full-text article views including HTML views, PDF and ePub downloads, according to the available data) and Abstracts Views on Vision4Press platform.
Data correspond to usage on the plateform after 2015. The current usage metrics is available 48-96 hours after online publication and is updated daily on week days.
Initial download of the metrics may take a while.