Fig. 35.
Download original image
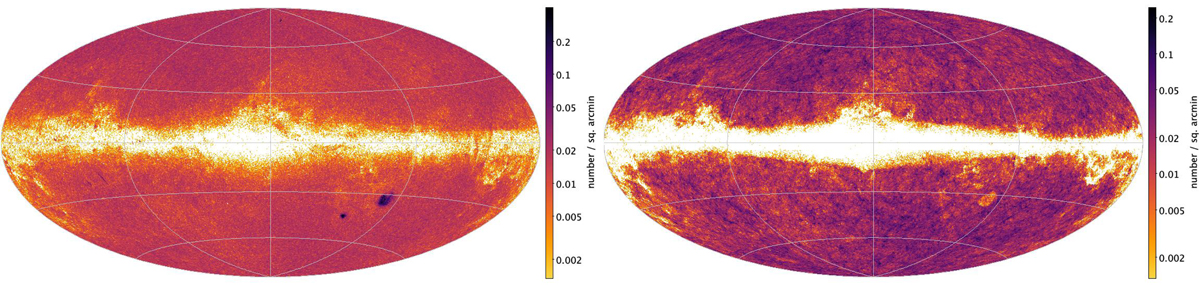
Galactic sky distribution of all the purer sub-sample of sources in the qso_candidates table (left) and galaxy_candidates table (right). The plot is shown at HEALpixel level 7 (0.210 sq. deg) in Hammer–Aitoff projection. The colour scale, which is logarithmic, covers the full range for each panel, so is different for each panel. Compare to Fig. 5 for the full tables.
Current usage metrics show cumulative count of Article Views (full-text article views including HTML views, PDF and ePub downloads, according to the available data) and Abstracts Views on Vision4Press platform.
Data correspond to usage on the plateform after 2015. The current usage metrics is available 48-96 hours after online publication and is updated daily on week days.
Initial download of the metrics may take a while.