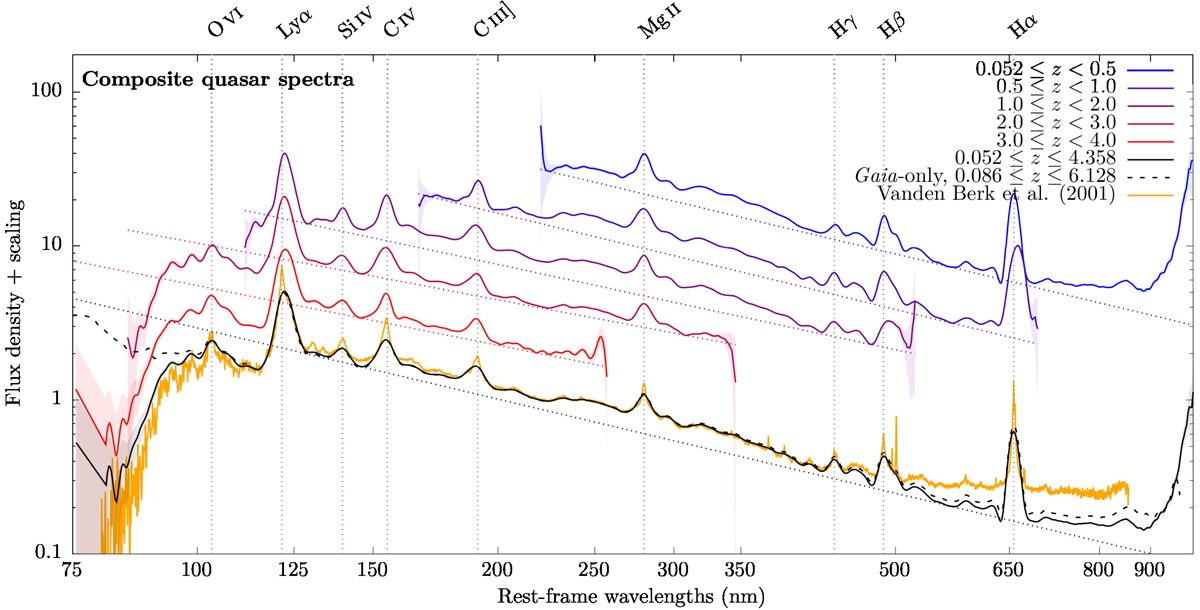
Fig. 33.
Download original image
Composite quasar spectra. The thick solid lines show composites made from the 42 944 BP/RP spectra with spectroscopically-confirmed redshifts from the Milliquas 7.2 quasar catalogue of Flesch (2021, i.e. type = Q in Milliquas). The different colours are for different redshift ranges. The thick dotted black line shows the composite made from 111 563 BP/RP spectra with reliable QSOC redshift estimates (identified using the query given in Appendix B.2). The diagonal dotted line under each spectrum shows the quasar continuum, as described in Sect. 7 and defined in Table 9. Vertical dotted lines indicate common quasar emission lines. For comparison purposes we also show the median SDSS composite spectrum of Vanden Berk et al. (2001) (orange line). The flux densities are tabulated in Table 8.
Current usage metrics show cumulative count of Article Views (full-text article views including HTML views, PDF and ePub downloads, according to the available data) and Abstracts Views on Vision4Press platform.
Data correspond to usage on the plateform after 2015. The current usage metrics is available 48-96 hours after online publication and is updated daily on week days.
Initial download of the metrics may take a while.