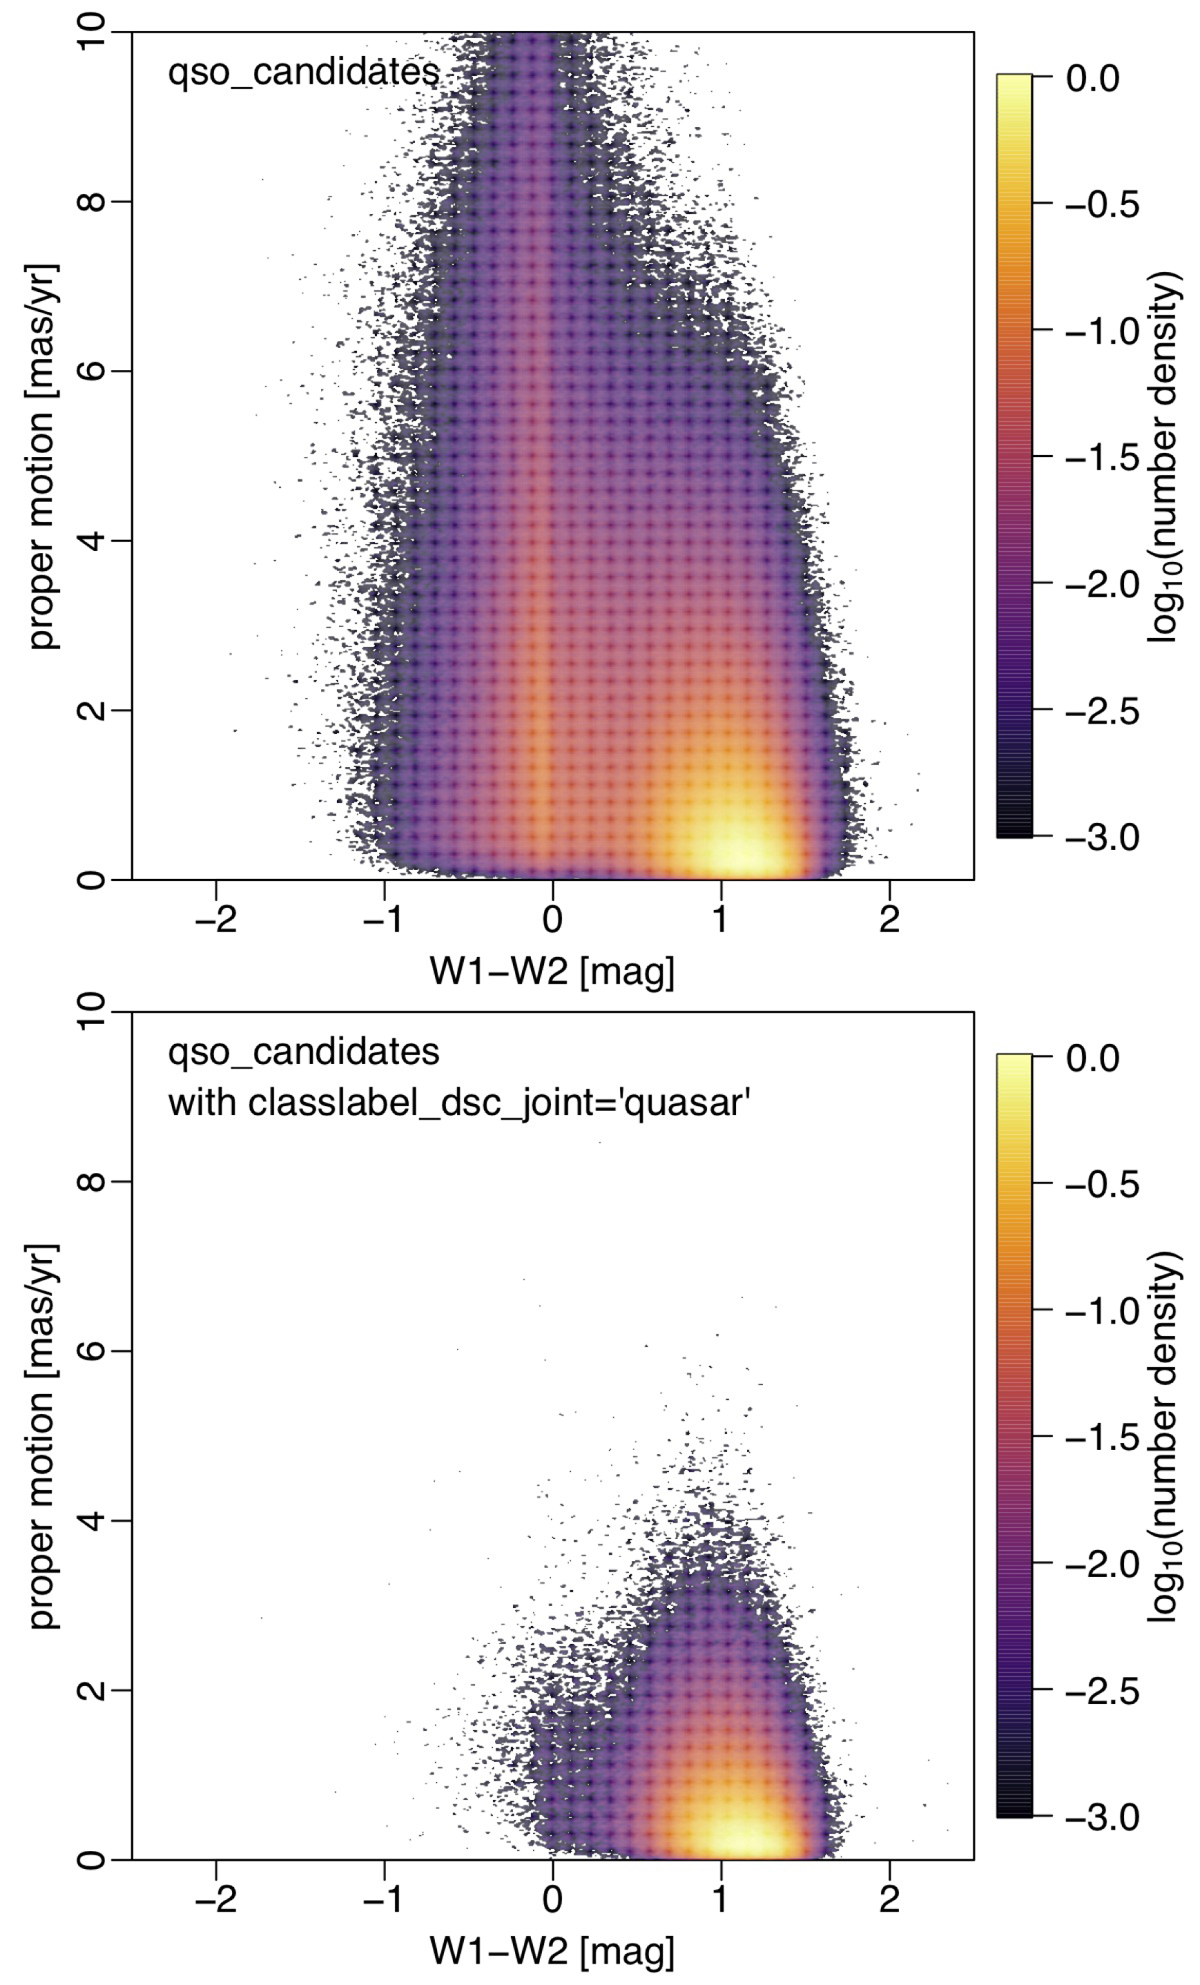
Fig. 28.

Download original image
Gaia proper motion vs. catWISE W1 − W2 colour for all sources in the qso_candidates table (top) and the subset with classlabel_dsc_joint = quasar (bottom). Regions around the LMC and SMC are excluded. The colour scale shows the density of sources on a log scale relative to the peak density (densities 1000 times lower than the peak are not shown).
Current usage metrics show cumulative count of Article Views (full-text article views including HTML views, PDF and ePub downloads, according to the available data) and Abstracts Views on Vision4Press platform.
Data correspond to usage on the plateform after 2015. The current usage metrics is available 48-96 hours after online publication and is updated daily on week days.
Initial download of the metrics may take a while.


