Open Access
Fig. 20.
Download original image
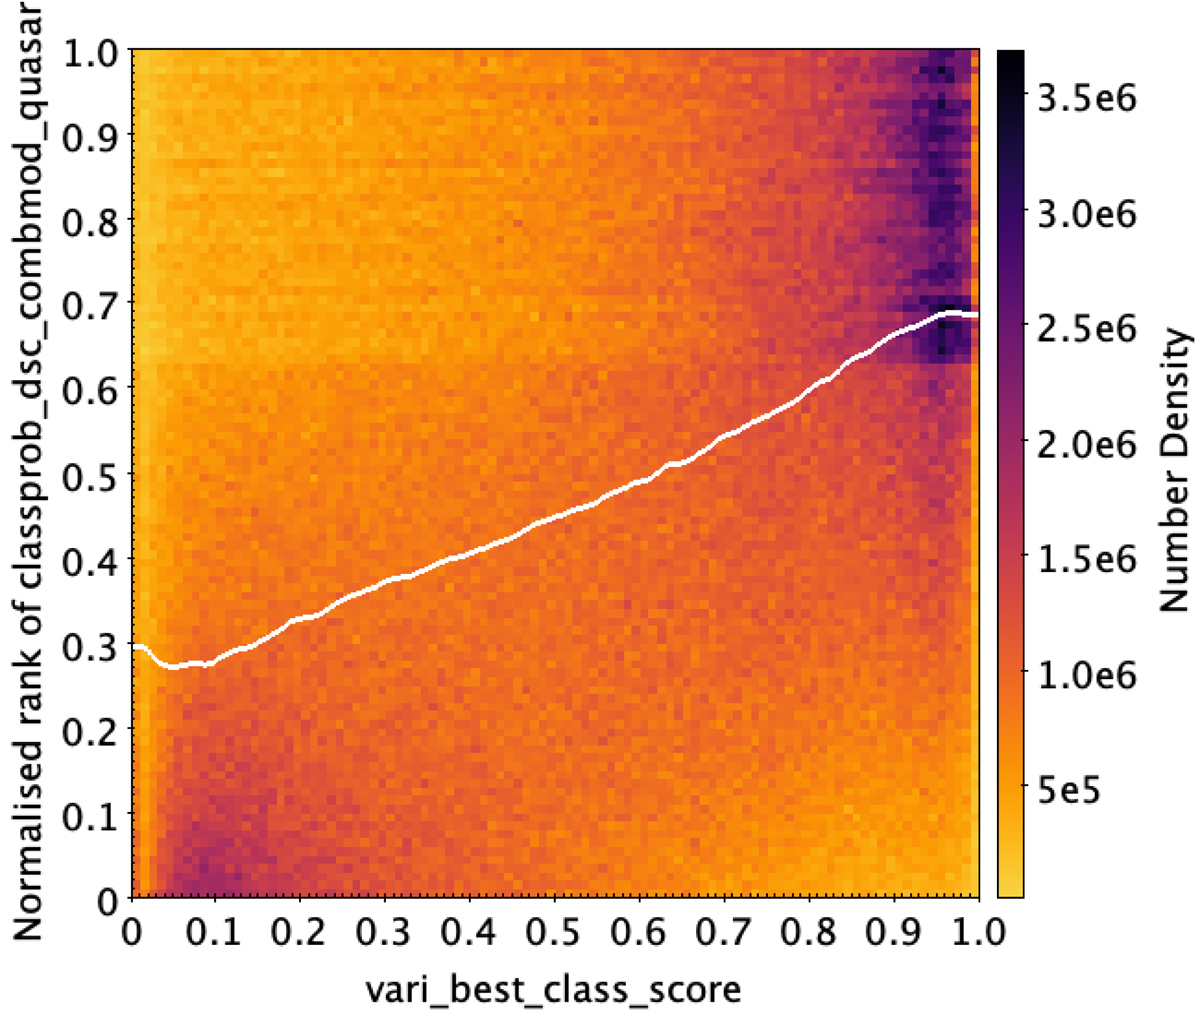
Comparison of DSC quasar classification probabilities (transformed to normalized ranks) with scores from the variability analysis. Darker colours depict higher densities, and the white line indicates the median rank. We see a broad agreement between the highest and lowest ranked quasars.
Current usage metrics show cumulative count of Article Views (full-text article views including HTML views, PDF and ePub downloads, according to the available data) and Abstracts Views on Vision4Press platform.
Data correspond to usage on the plateform after 2015. The current usage metrics is available 48-96 hours after online publication and is updated daily on week days.
Initial download of the metrics may take a while.