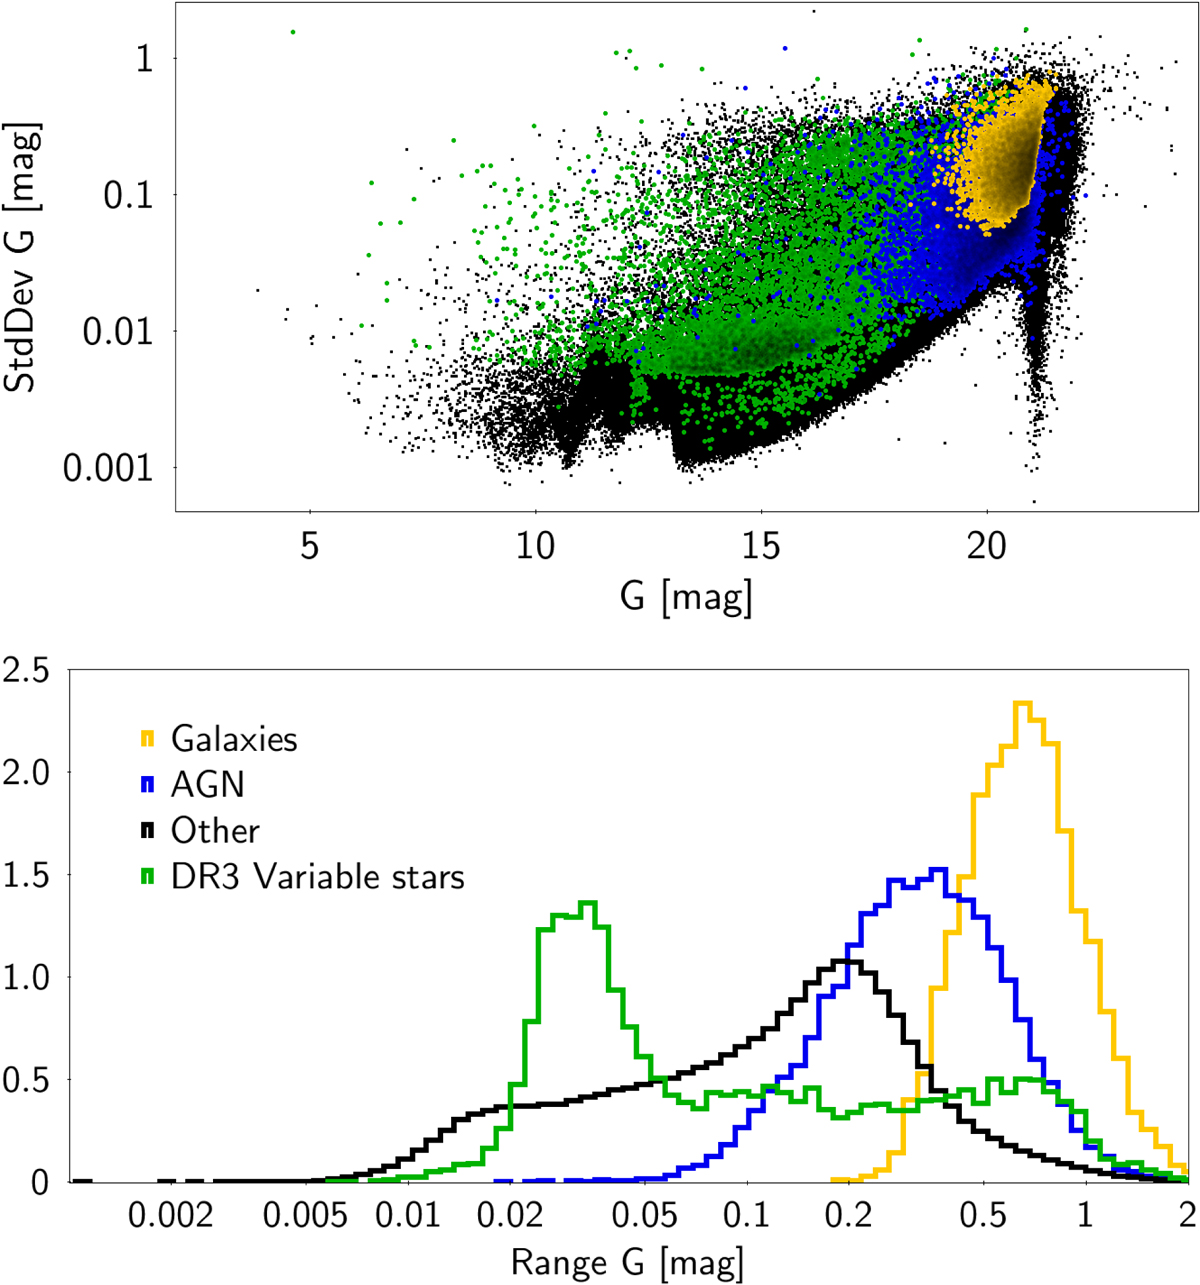
Fig. 19.
Download original image
Statistics of light curves of objects in the Gaia Andromeda Photometric Survey. Top: standard deviation versus median G magnitude. Bottom: normalized distribution of minimum-to-maximum variability range for G band light curves. Both panels are colour-coded as in Fig. 18. The distributions overlap in the upper panel, with galaxies covering AGN, for example.
Current usage metrics show cumulative count of Article Views (full-text article views including HTML views, PDF and ePub downloads, according to the available data) and Abstracts Views on Vision4Press platform.
Data correspond to usage on the plateform after 2015. The current usage metrics is available 48-96 hours after online publication and is updated daily on week days.
Initial download of the metrics may take a while.