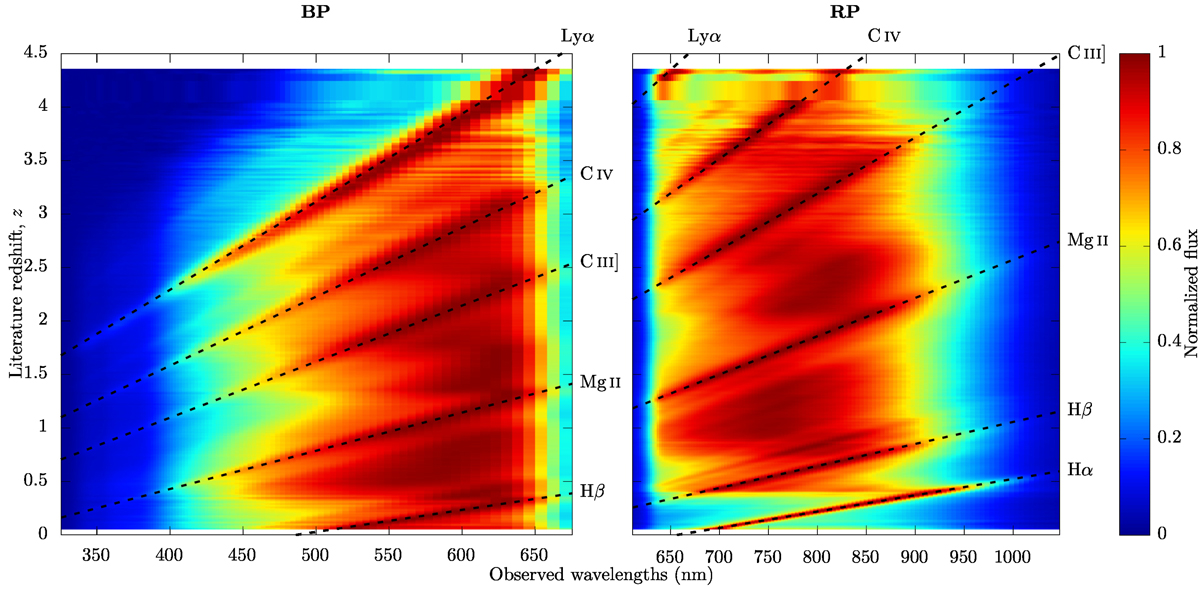
Fig. 10.
Download original image
Distribution of the BP flux (left) and RP flux (right) as sampled by SMS-gen (Creevey et al. 2023) of 42 944 quasars published in Gaia DR3 that have spectroscopically confirmed redshifts in the Milliquas 7.2 quasar catalogue of (Flesch 2021; type = Q). Dotted lines show the dominant quasar emission lines. Spectra are individually normalized in order to have a maximum flux of 1.0 and are then averaged in redshift bins of 0.01, with the inverse variance of the sampled fluxes used as the weight during the computation of the mean.
Current usage metrics show cumulative count of Article Views (full-text article views including HTML views, PDF and ePub downloads, according to the available data) and Abstracts Views on Vision4Press platform.
Data correspond to usage on the plateform after 2015. The current usage metrics is available 48-96 hours after online publication and is updated daily on week days.
Initial download of the metrics may take a while.