Fig. 2.
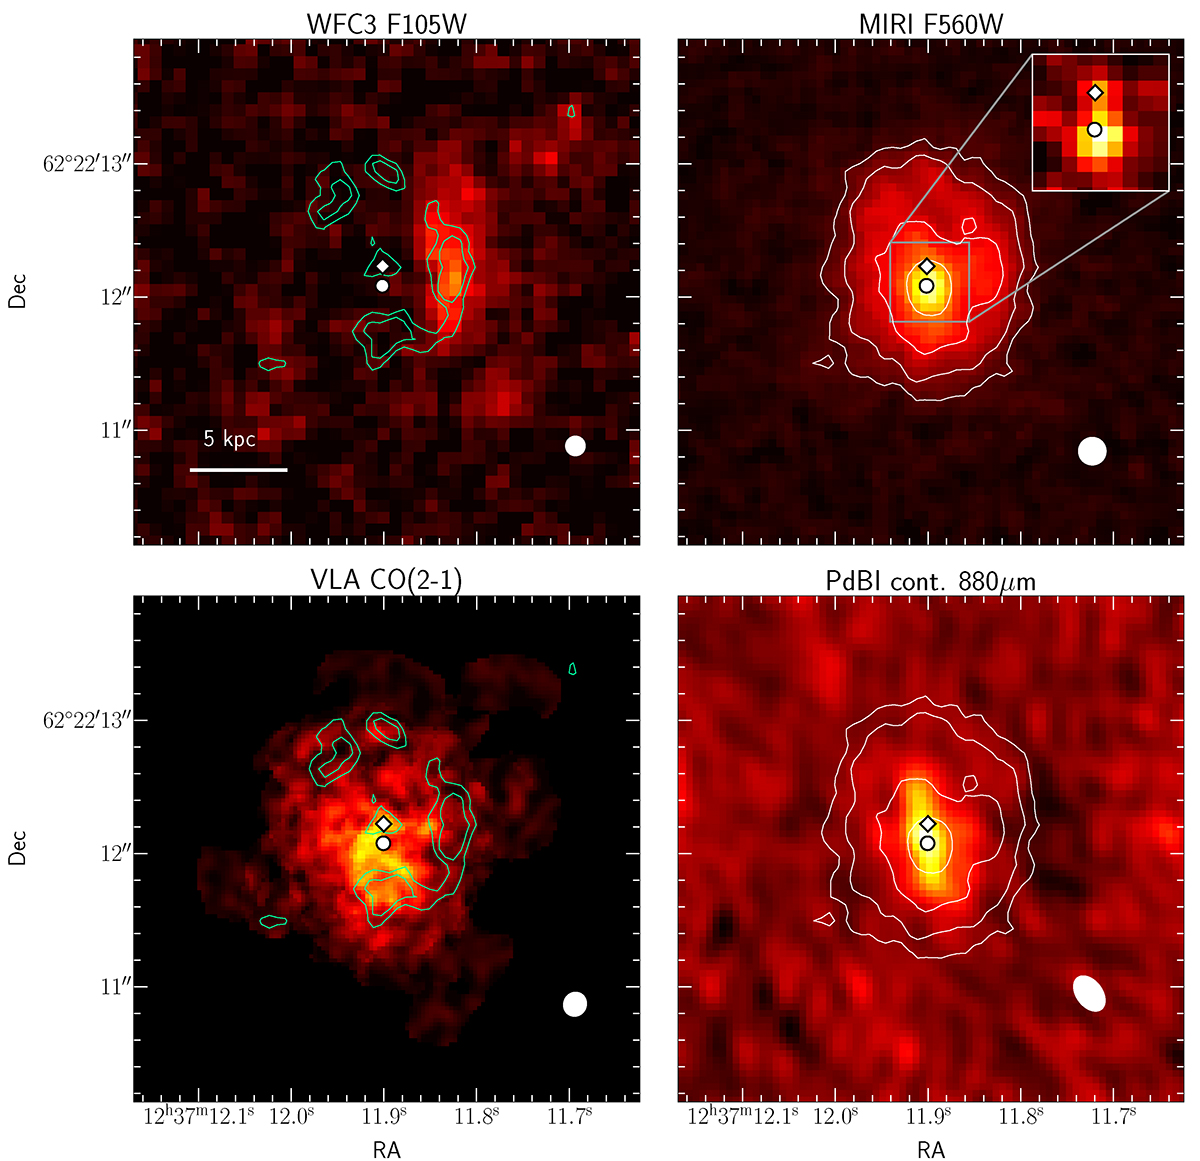
Download original image
Multi-wavelength morphology of GN20. Top panels display the WFC3 F105W (left) and MIRI F560W (right) images of GN20, tracing the rest-frame UV (0.2 μm) and near-IR (1.1 μm) light, respectively. Bottom left panel shows the CO(2-1) flux map, obtained with the VLA. Bottom right panel displays the rest-frame 170 μm continuum map from PdBI observations. Black-edged white diamond and circle mark the position of the centre for the nuclear point-source and extended components derived from the 2D brightness decomposition (see Sect. 3.1). White circles and ellipses at the bottom right corner of the panels represent the PSF or beam size for the different images. White contours on the right panels represent the F560W isophotes at 5σ, 10σ, 20σ, and 35σ levels. Green contours in the left panels mark the residuals of the near-IR light distribution fit (see Fig. 1) at 3σ and 5σ levels. The inset in the F560W image represents the central 0.6″ × 0.6″ region with the presence of the secondary nucleus as obtained from the deconvolution of the F560W image (see Sect. 3.1).
Current usage metrics show cumulative count of Article Views (full-text article views including HTML views, PDF and ePub downloads, according to the available data) and Abstracts Views on Vision4Press platform.
Data correspond to usage on the plateform after 2015. The current usage metrics is available 48-96 hours after online publication and is updated daily on week days.
Initial download of the metrics may take a while.