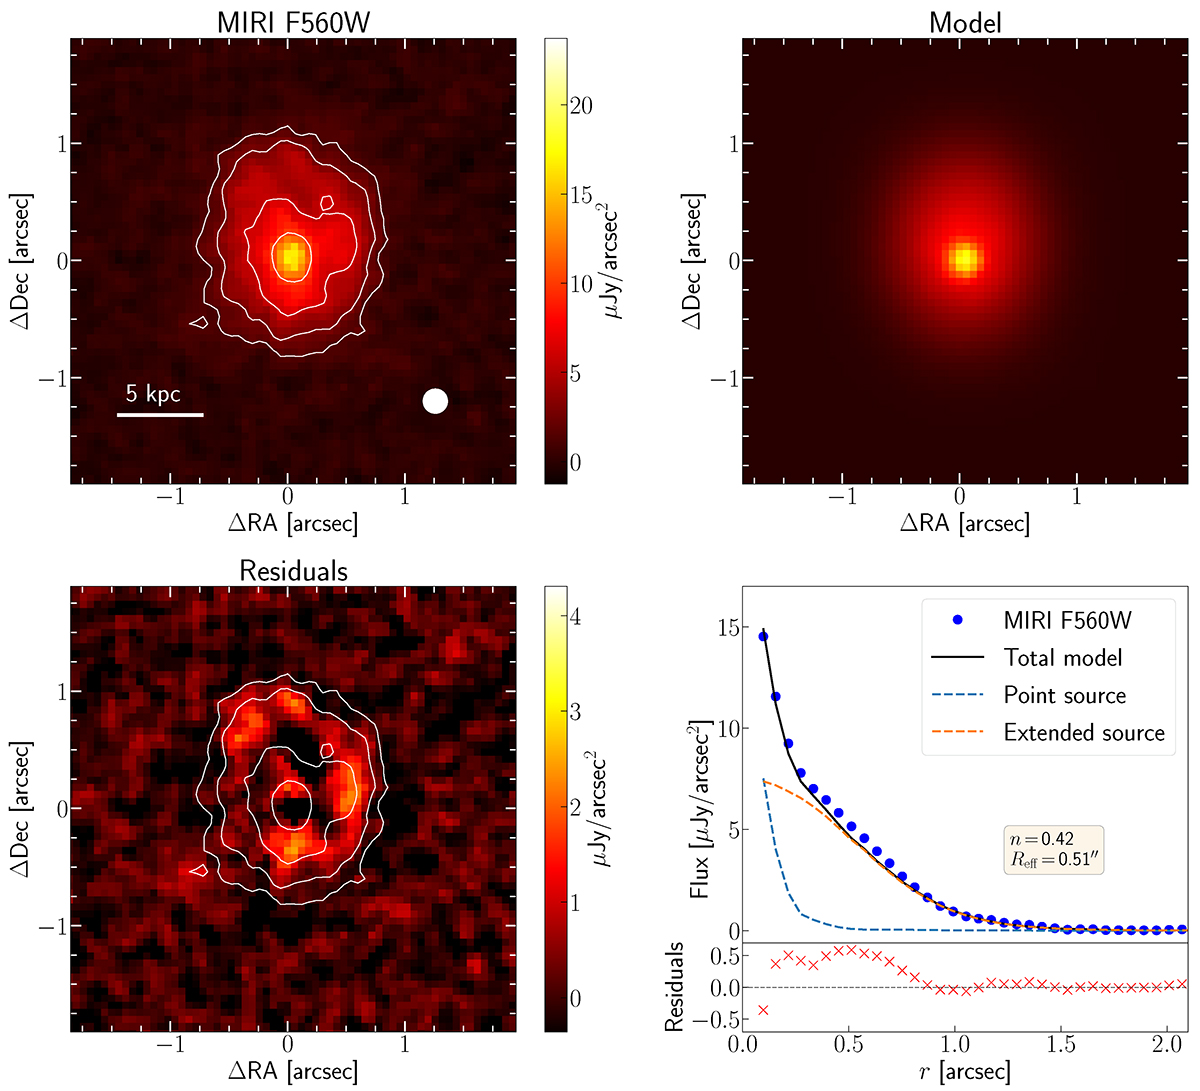
Fig. 1.
Download original image
Two-dimensional, two-component (PSF + Sérsic) fit to the GN20 light distribution. The panels represent the original MIRI F560W image (top left), the best-fit model obtained with Lenstronomy (top right), and its residuals (bottom left), respectively. Bottom right panel shows the radial profile of the original image (blue dots), best-fit model (black line), and residuals (red crosses) maps. In addition, blue and orange dashed lines represent the radial profiles of the nuclear point-source and extended components used in the modelling of the light distribution. Contours represent the F560W isophotes at 5σ, 10σ, 20σ, and 35σ levels.
Current usage metrics show cumulative count of Article Views (full-text article views including HTML views, PDF and ePub downloads, according to the available data) and Abstracts Views on Vision4Press platform.
Data correspond to usage on the plateform after 2015. The current usage metrics is available 48-96 hours after online publication and is updated daily on week days.
Initial download of the metrics may take a while.