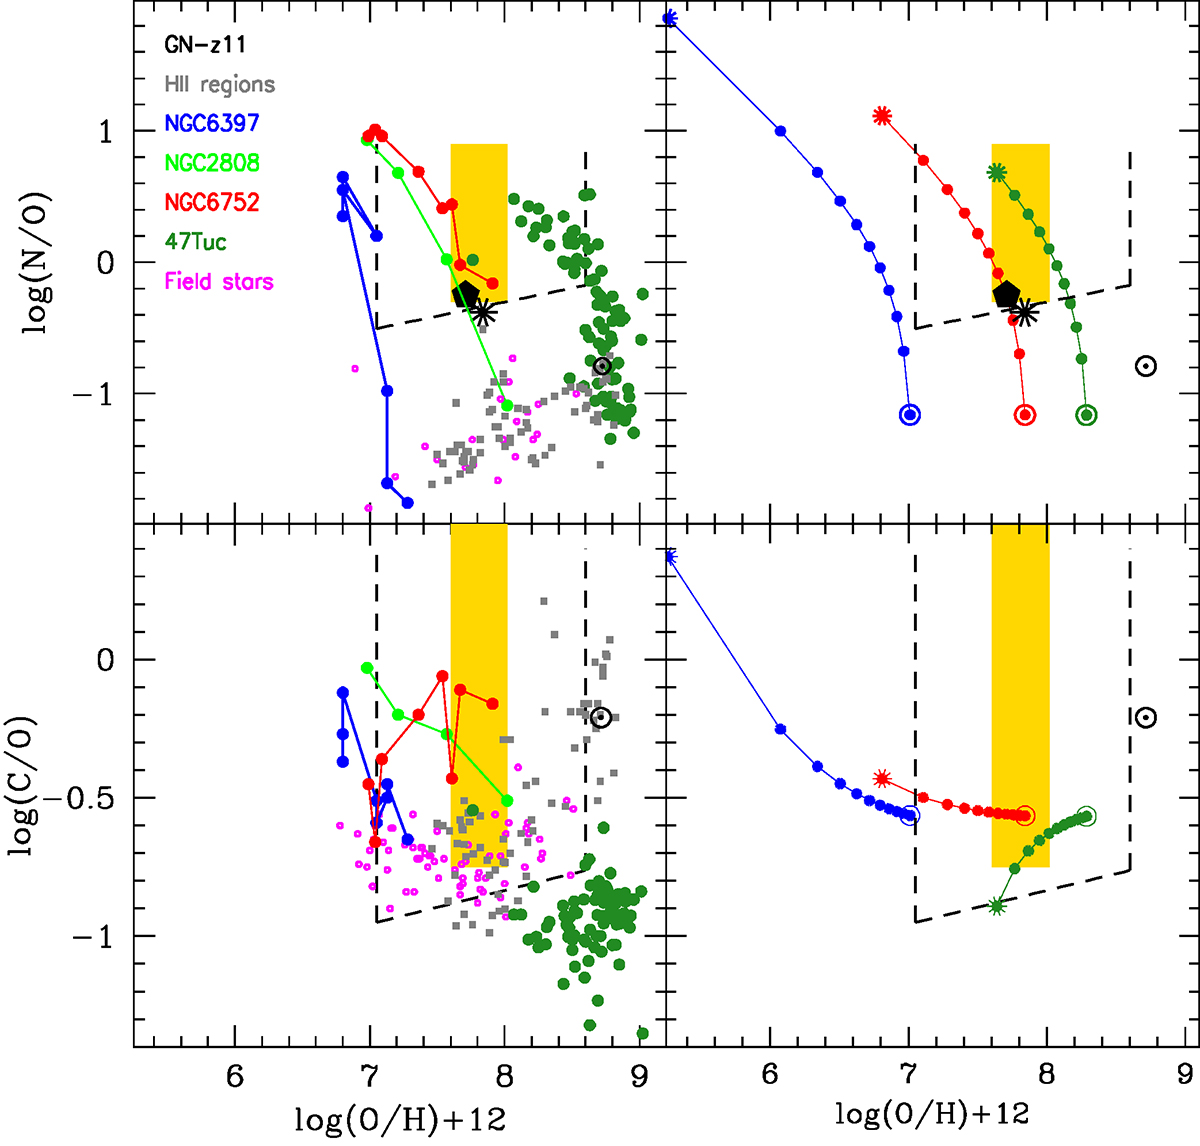
Fig. 1.
Download original image
Abundance ratios in GN-z11 and other environments, and a comparison with SMS models. The yellow box and the dashed black line show the location of the abundance ratios of GN-z11 from the Cameron et al. (2023) fiducial model and from their more conservative assumptions, respectively (with upper boundaries that are not well defined). The black pentagon and asterisk indicate the location of Senchyna et al. (2023) photoionization modeling results for GN-z11. Left: Abundance ratios in individual stars of four GCs (NGC 6397, Carretta et al. 2005; NGC 2808, Carlos et al. 2023; NGC 6752, Carretta et al. 2005; 47 Tuc, Mészáros et al. 2020), and in Milky Way field stars within the same metallicity range as the four GCs (Israelian et al. 2004; Akerman et al. 2004; Fabbian et al. 2009); for the GCs we have connected the points by line segments to guide the eye. The gray squares are the abundance ratios for extragalactic HII regions and galaxies (compilation from Izotov et al. 2023). Right: Theoretical abundance ratios as predicted from the dilution of the material of 104 M⊙ SMS models with the assumed initial proto-GC abundances for the same metallicities as NGC 6397, NGC 6752, and 47 Tuc (blue, red, and green respectively). Along each GC sequence, the fraction of SMS H-processed material in the mixture decreases from one (pure SMS, asterisk symbols) to zero (pure proto-GC gas, open circles) with steps of 0.1 (full circles).
Current usage metrics show cumulative count of Article Views (full-text article views including HTML views, PDF and ePub downloads, according to the available data) and Abstracts Views on Vision4Press platform.
Data correspond to usage on the plateform after 2015. The current usage metrics is available 48-96 hours after online publication and is updated daily on week days.
Initial download of the metrics may take a while.