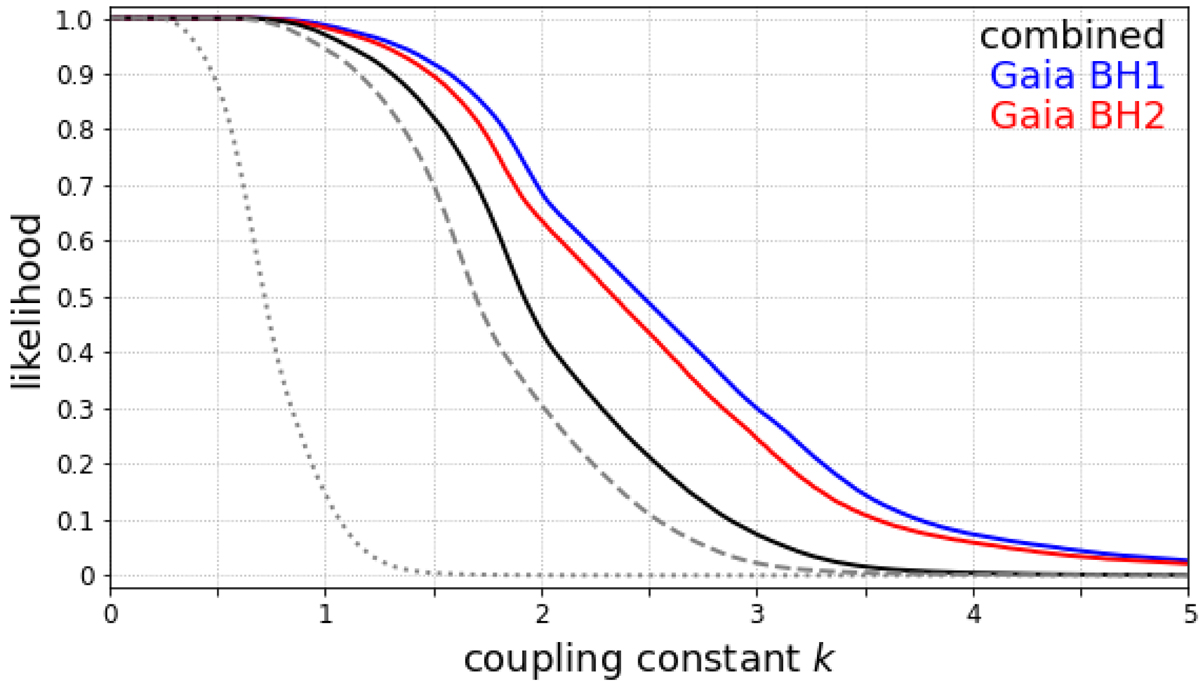
Fig. 3.
Download original image
Likelihood of original BH mass at formation being below the TOV limit of 2.2 M⊙ as a function of coupling constant k. The blue line is for Gaia BH1, red for Gaia BH2, and black for the combination of both. As the measurements of Gaia BH1 and BH2 are statistically independent, the combination is simply the product of the two individual likelihoods. Additionally, the gray-dashed line shows the combined results for a higher TOV limit of 2.6 M⊙ (Rocha et al. 2021) while the gray dotted line shows the combined results for a mass gap with a minimal BH mass of 5.4 M⊙ (Ye & Fishbach 2022).
Current usage metrics show cumulative count of Article Views (full-text article views including HTML views, PDF and ePub downloads, according to the available data) and Abstracts Views on Vision4Press platform.
Data correspond to usage on the plateform after 2015. The current usage metrics is available 48-96 hours after online publication and is updated daily on week days.
Initial download of the metrics may take a while.