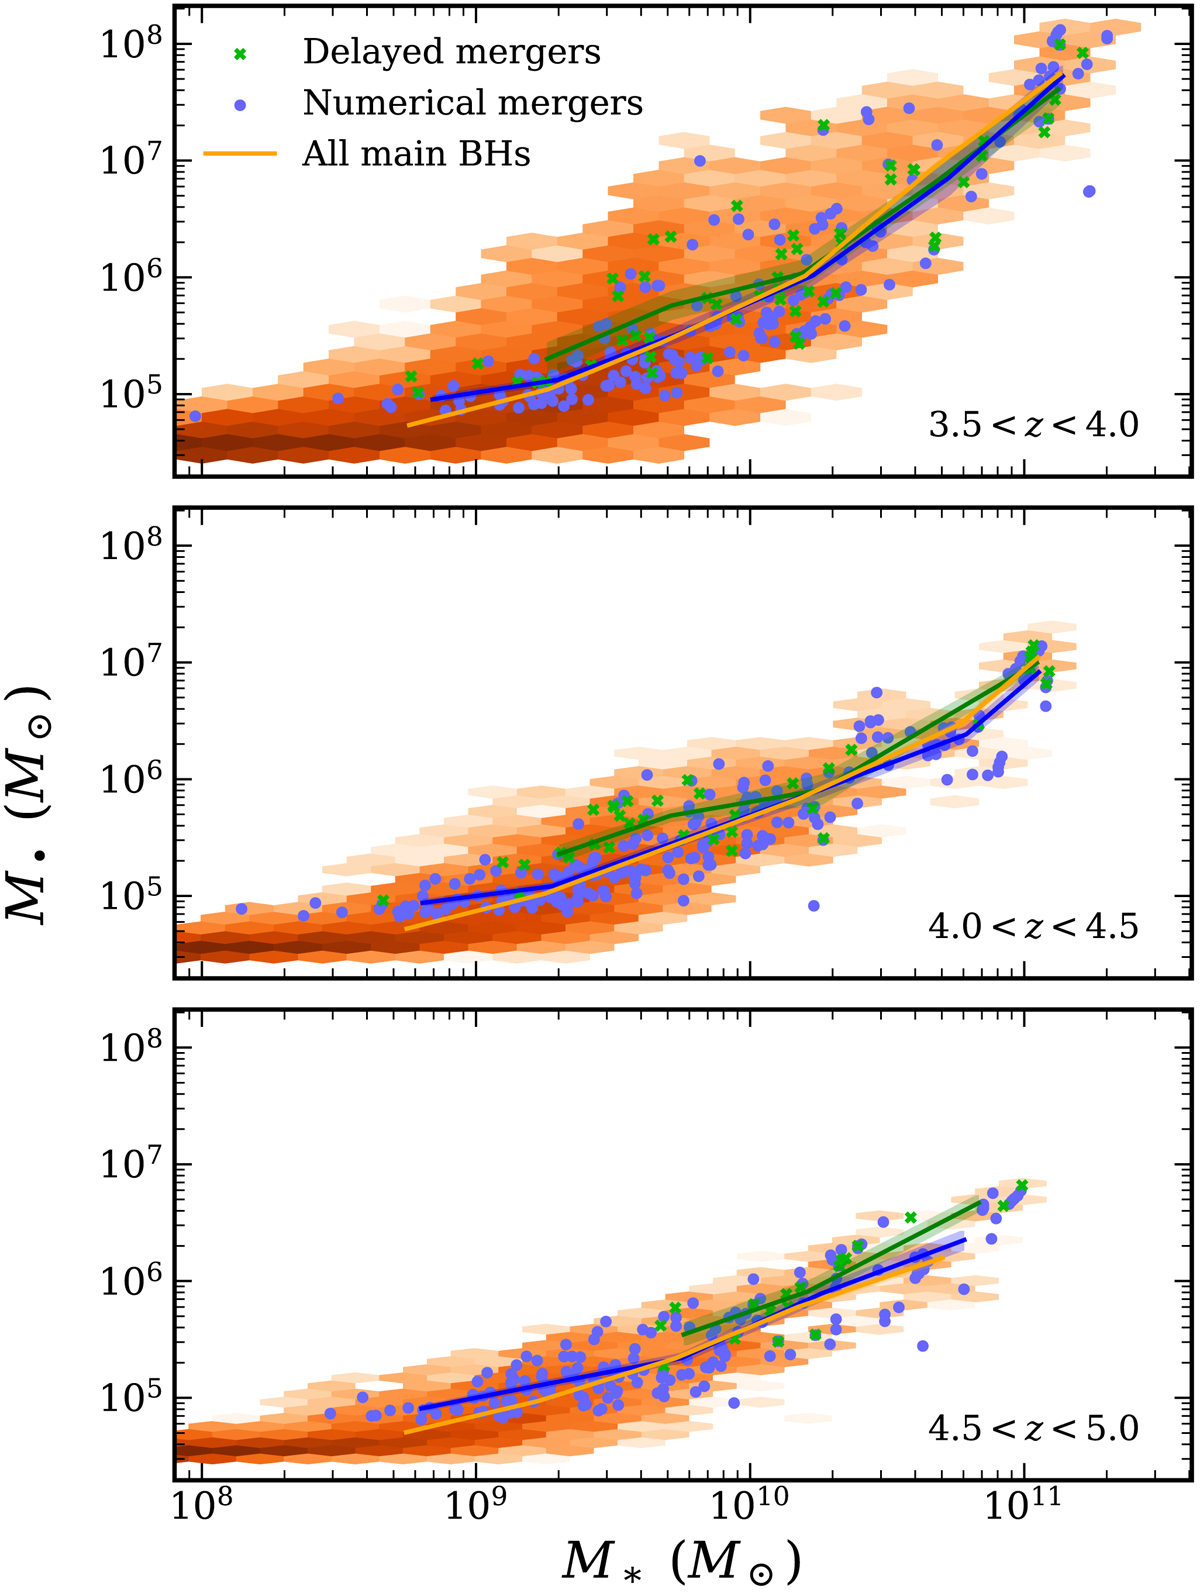
Fig. 9.
Download original image
Correlation between BH mass and galaxy mass at different redshift ranges: 3.5 < z < 4, 4 < z < 4.5, and 4.5 < z < 5. The notation is identical to Fig. 4. At constant M*, M• increases with redshift for z<. Delayed mergers are overmassive on average at certain galaxy masses at all redshifts, although the average lies within the scatter of the global relation.
Current usage metrics show cumulative count of Article Views (full-text article views including HTML views, PDF and ePub downloads, according to the available data) and Abstracts Views on Vision4Press platform.
Data correspond to usage on the plateform after 2015. The current usage metrics is available 48-96 hours after online publication and is updated daily on week days.
Initial download of the metrics may take a while.