Fig. 5.
Download original image
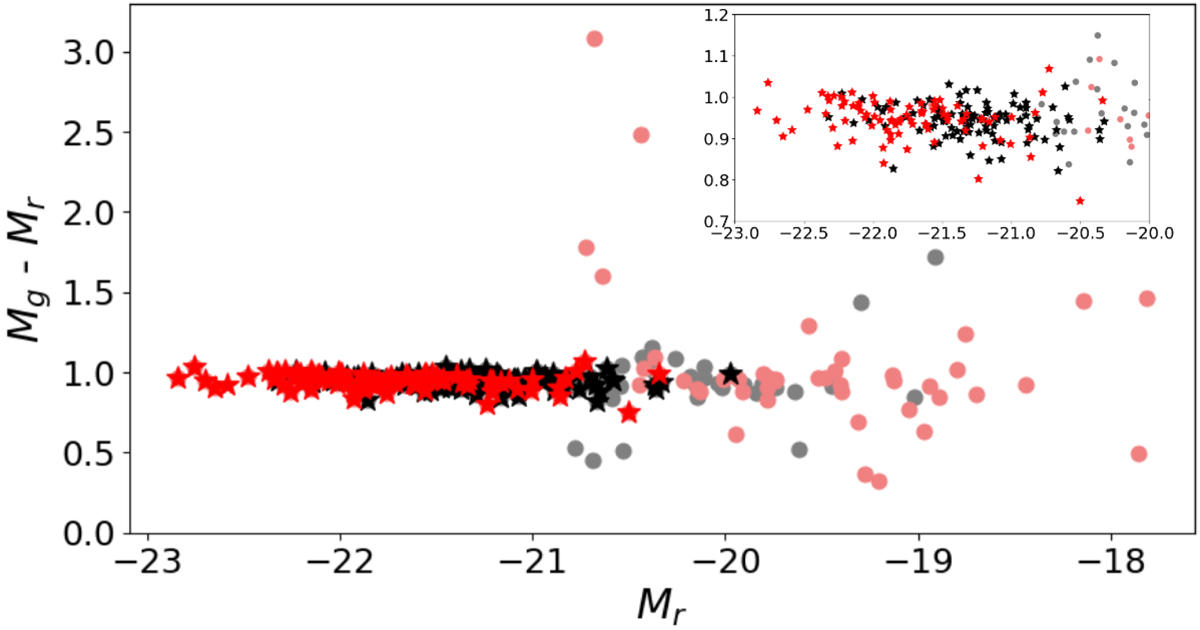
(g − r) colour magnitude diagram for four samples: light red dots: galaxies within 1 arcmin of FG BGGs; red stars: FG BGGs; grey dots: all galaxies within 1 arcmin of non-FG BGGs; black stars: non-FG BGGs. The x-axis is the absolute magnitude in the r band. A zoomed-in version of the plot at the brightest magnitudes is shown in the top right corner.
Current usage metrics show cumulative count of Article Views (full-text article views including HTML views, PDF and ePub downloads, according to the available data) and Abstracts Views on Vision4Press platform.
Data correspond to usage on the plateform after 2015. The current usage metrics is available 48-96 hours after online publication and is updated daily on week days.
Initial download of the metrics may take a while.