Fig. 9
Download original image
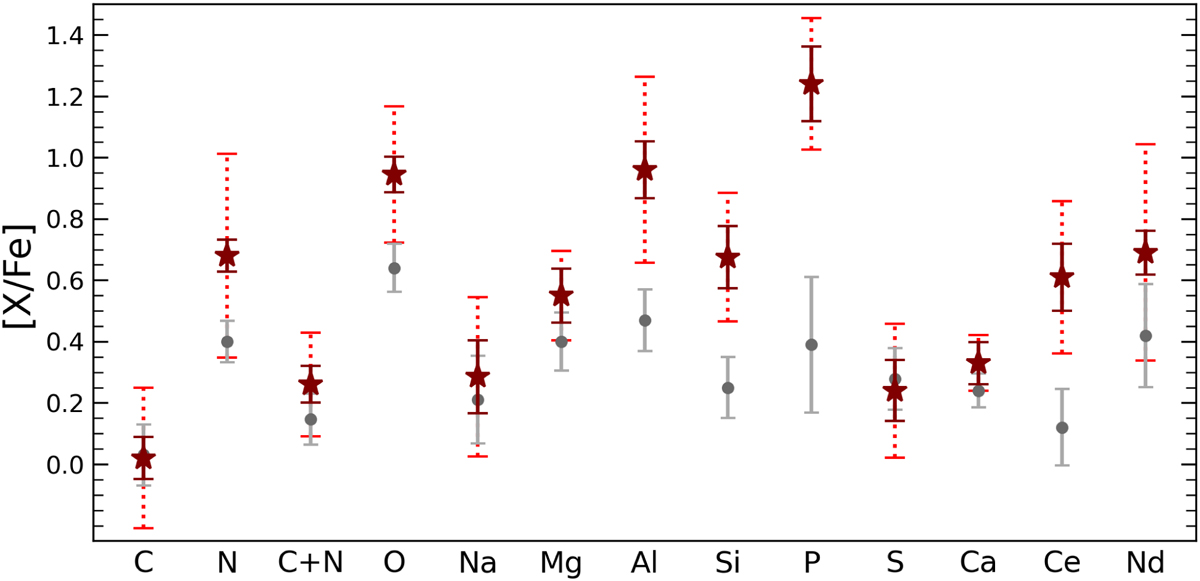
Chemical abundance pattern of our sample of P-rich stars. Dark red stars correspond to the median chemical abundance of the P-rich sample, and gray dots show the median chemical abundance of the background sample. Stars with upper limits were excluded from the median. The red and gray error bars denote the corresponding average line-to-line abundance scatter (typical standard deviation) from Table D.2, which reflects the quality of the measurements. We also provide the star-to-star abundance scatter of the sample as dotted error bars to reflect the spread of abundances. In the case of P, the gray dot indicates the median abundance of the literature values shown in Fig. 5, and the gray error bar shows the mean error of the literature values.
Current usage metrics show cumulative count of Article Views (full-text article views including HTML views, PDF and ePub downloads, according to the available data) and Abstracts Views on Vision4Press platform.
Data correspond to usage on the plateform after 2015. The current usage metrics is available 48-96 hours after online publication and is updated daily on week days.
Initial download of the metrics may take a while.