Open Access
Fig. 8
Download original image
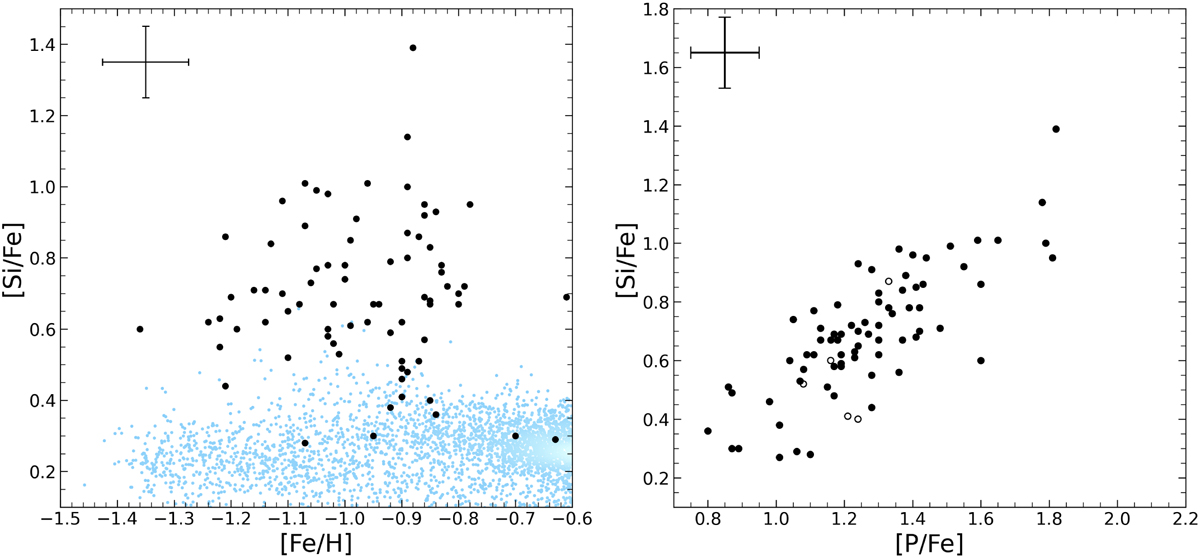
Detailed representation of the [Si/Fe] abundance ratio. Left panel: zoom into the [Si/Fe] vs. [Fe/H] plot of Fig. 6. Right panel: [Si/Fe] vs. [P/Fe]. Solid circles correspond to real measurements in both Si and in P, and empty circles denote upper limits in P.
Current usage metrics show cumulative count of Article Views (full-text article views including HTML views, PDF and ePub downloads, according to the available data) and Abstracts Views on Vision4Press platform.
Data correspond to usage on the plateform after 2015. The current usage metrics is available 48-96 hours after online publication and is updated daily on week days.
Initial download of the metrics may take a while.