Fig. 7
Download original image
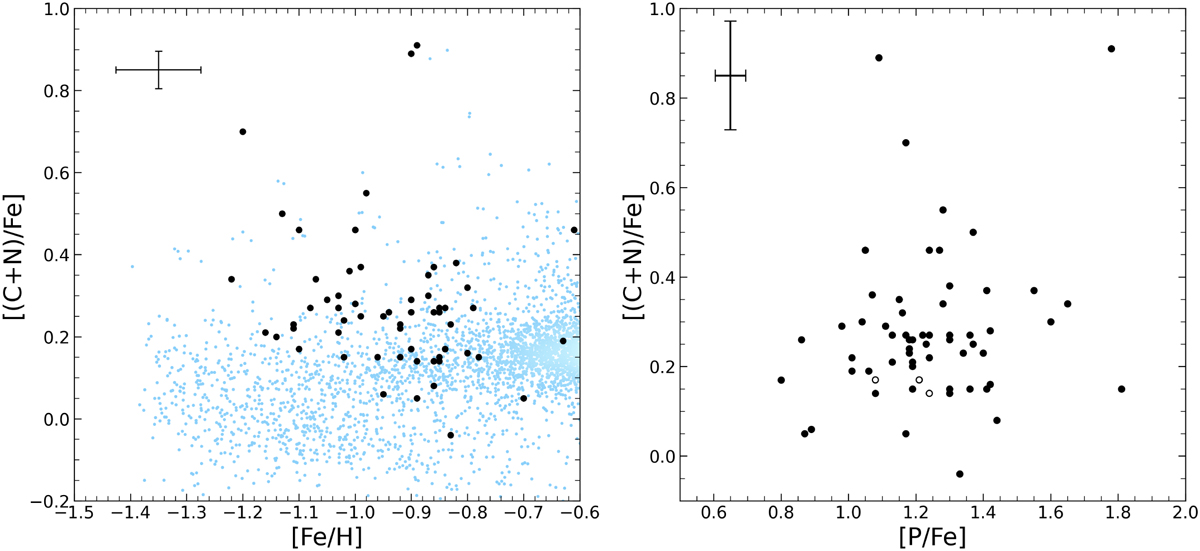
Detailed representation of the [(C+N)/Fe] abundance ratio. Left panel: abundance ratio [(C+N)/Fe] vs. metallicity [Fe/H]. Stars with upper limits in C or N have not been considered. Right panel: [(C+N)/Fe] vs. [P/Fe]. Solid circles correspond to real measurements in P, and empty circles denote upper limits in P. In both panels, the error of [(C+N)/Fe] was defined as the quadratic sum of the standard deviation of the C and N measurements.
Current usage metrics show cumulative count of Article Views (full-text article views including HTML views, PDF and ePub downloads, according to the available data) and Abstracts Views on Vision4Press platform.
Data correspond to usage on the plateform after 2015. The current usage metrics is available 48-96 hours after online publication and is updated daily on week days.
Initial download of the metrics may take a while.