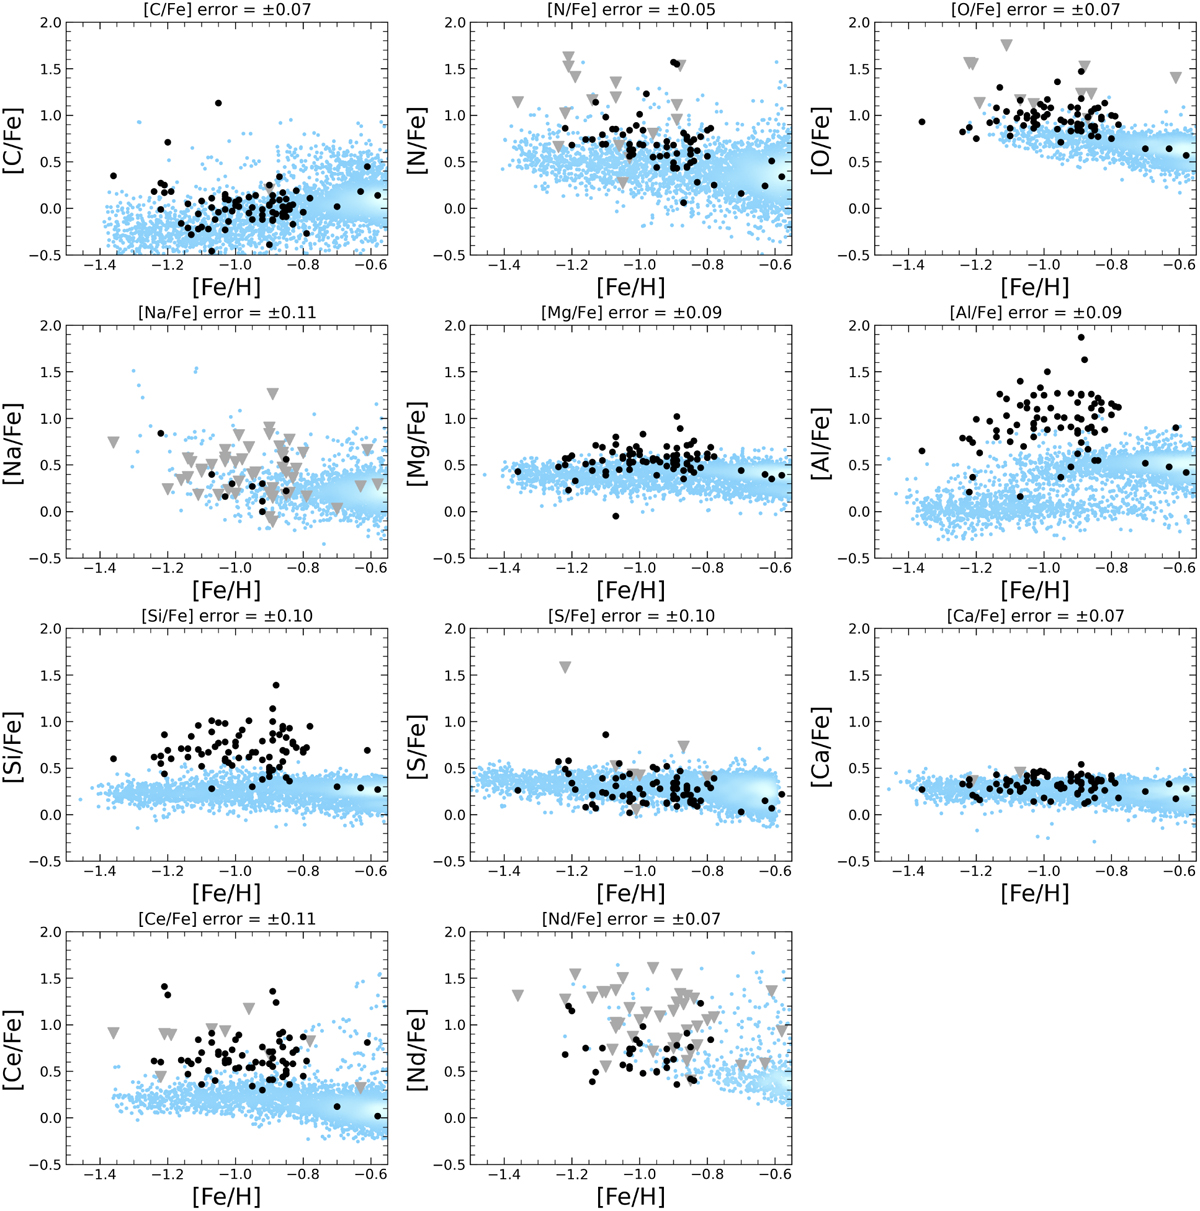
Fig. 6
Download original image
Abundance ratios [X/Fe] vs. metallicity [Fe/H], displaying one element X in each panel. Gray downward triangles indicate upper limits. The background sample was selected and the corresponding abundances were calculated following the procedure described in Sects. 2.2 and 3.2, respectively. In the case of S, the background stars and their corresponding abundances have been extracted from the VAC from Hayes et al. (2022). The color-coding reflects the number density of the stars. For clarity, error bars are suppressed. The errors adopted for each element are given in the title of each panel and correspond to the average standard deviation listed in Table D.2. The error of the metallicity [Fe/H] is ±0.08.
Current usage metrics show cumulative count of Article Views (full-text article views including HTML views, PDF and ePub downloads, according to the available data) and Abstracts Views on Vision4Press platform.
Data correspond to usage on the plateform after 2015. The current usage metrics is available 48-96 hours after online publication and is updated daily on week days.
Initial download of the metrics may take a while.