Fig. 2
Download original image
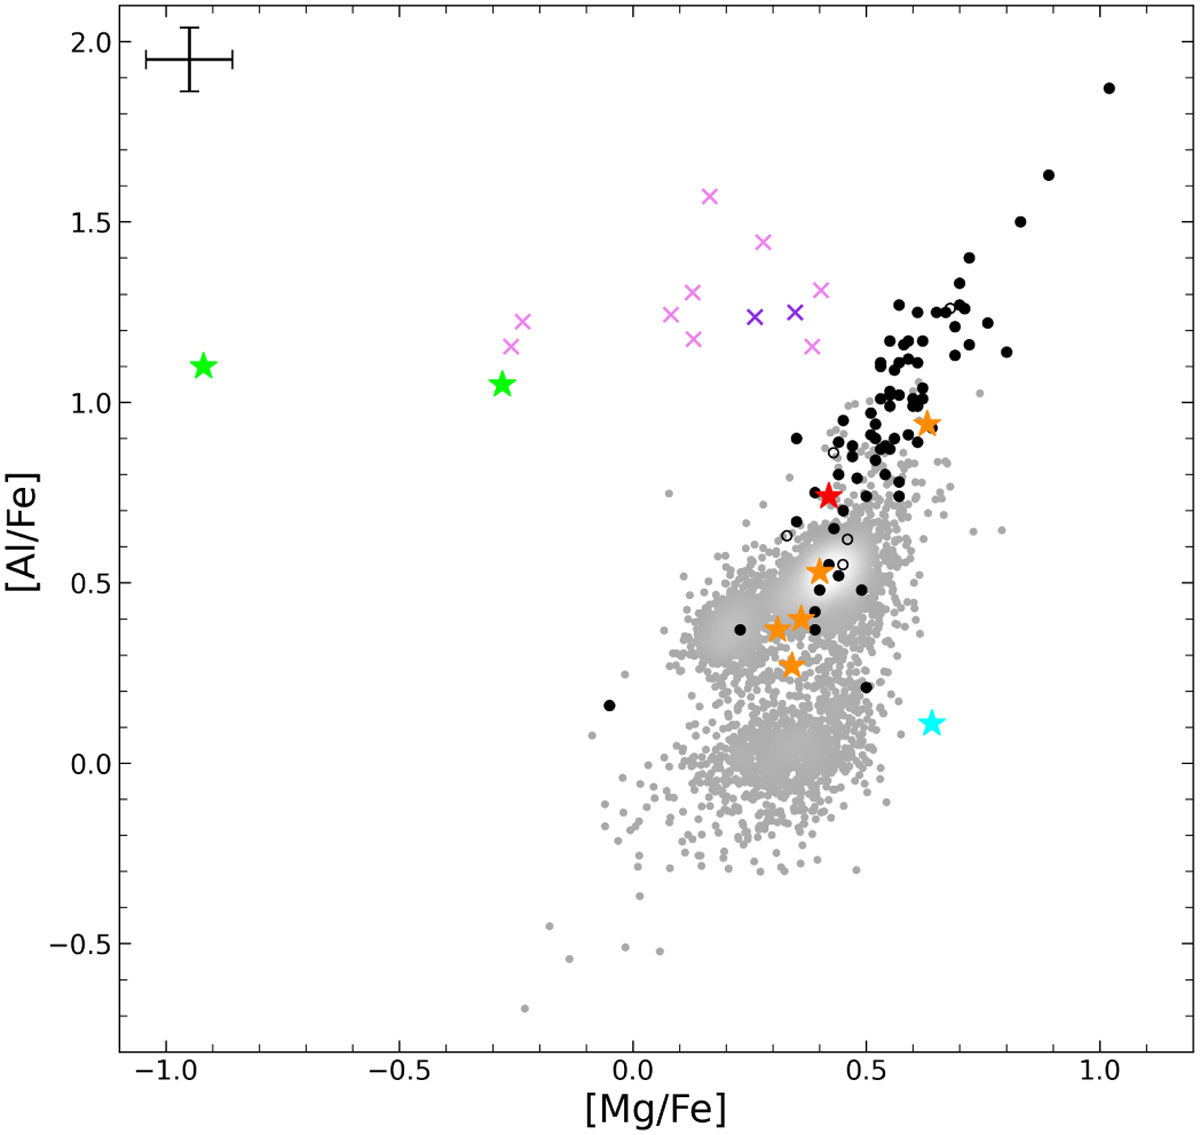
Abundances in the [Al/Fe]-[Mg/Fe] plane, showing the background stars (gray color-coded density map) and the full P-rich candidates sample (black circles) described in Sect. 2.2. Empty black circles represent upper limits in [P/Fe]. Outliers identified in this or the plane shown in Fig. 3 are highlighted with orange, green, and blue stars. The red star corresponds to the P-rich GC (M4) member 2M16231729-2624578. Violet crosses indicate outliers in the background sample with GC characteristics, two of which (dark violet crosses; 2M12155306+1431114, 2M 17350460-2856477) have a high [O/Fe] abundance ratio. As defined in Sect. 3.3, the error bar represents the typical standard deviation of the elements listed in Table D.2.
Current usage metrics show cumulative count of Article Views (full-text article views including HTML views, PDF and ePub downloads, according to the available data) and Abstracts Views on Vision4Press platform.
Data correspond to usage on the plateform after 2015. The current usage metrics is available 48-96 hours after online publication and is updated daily on week days.
Initial download of the metrics may take a while.